Relating formants to articulation
The positions for the first two formants of a vowel aren't random. Let's look more closely at
the formants we saw for Canadian English vowels:
| Vowel |
[i] | [ ] ] |
[e] | [ ] ] |
[æ] | [ ] ] |
[ ] ] | [o] |
[ ] ] | [u] |
[ ] ] |
| F1 |
280 | 370 | 405 | 600 |
860 | 830 | 560 | 430 |
400 | 330 | 680 |
| F2 |
2230 | 2090 | 2080 | 1930 |
1550 | 1170 | 820 | 980 |
1100 | 1260 | 1310 |
We can place each vowel on a graph, where the horizontal dimension represents the
frequency of the first formant (F1) and the vertical dimension represents the frequency
of the second formant (F2):

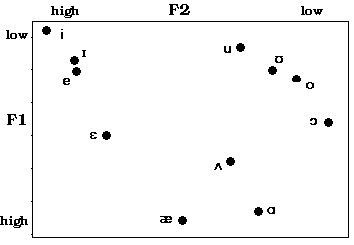
This is just a mirror image of our familiar vowel chart! If we change the axes of the
graph so that the horizontal dimension shows (decreasing) F2 and the vertical dimension
shows (decreasing) F1, we get something almost exactly like our vowel chart:

This means that a listener can essentially "hear" the position of the speaker's
tongue body.
- F1 is influenced by tongue body height
- F2 is influenced by tongue body frontness/backness
(An even more accurate indicator of frontness/backness than F2 is the difference
between the first two formants, i.e., F2 - F1.)
Next: Spectrograms
Previous: Formants
Up: Table of contents
 ]
]  ]
]  ]
]  ]
]  ]
]  ]
]  ]
]  ]
]  ]
]  ]
]  ]
]  ]
] 
