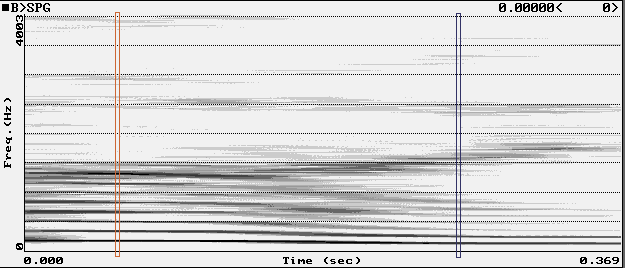
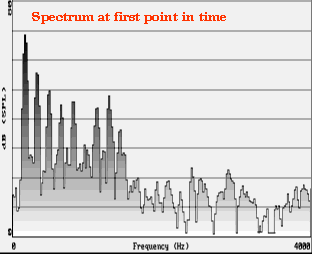
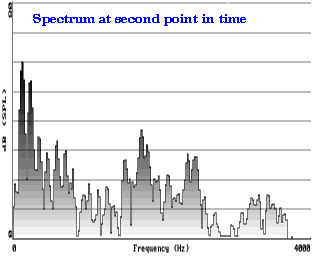
In a spectrogram, the horizontal dimension represents time and the vertical dimension represents frequency. Each thin vertical slice of the spectrogram shows the spectrum during a short period of time, using darkness to stand for amplitude. Darker areas show those frequencies where the simple component waves have high amplitude.
For situations where we are more interested in the frequency response curve of the vocal tract than in raw spectra, we can use "wide band" spectrograms. In these, the dark areas are smeared over a wider area. This often hides the individual harmonics, but it makes formants easier to see -- they show up as dark bands.
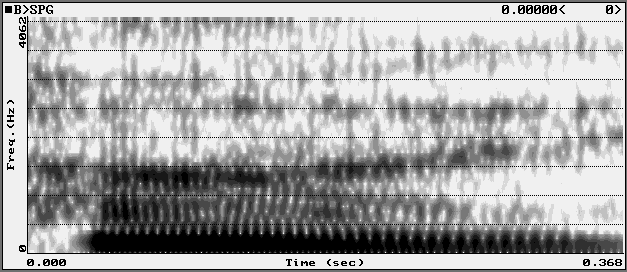
Spectrograms let us look at, for example, the changing formants in a diphthong.


