[ɪ]
Each of the preferred resonanting frequencies of the vocal tract (each bump in the frequency response curve) is known as a formant . They are usually referred to as F1, F2, F3, etc. For example, the formants for a schwa as spoken by an adult male whose vocal tract is 17 centimetres long:
| F1 | first formant | 500 Hz |
| F2 | second formant | 1500 Hz |
| F3 | third formant | 2500 Hz |
| ... |
(People whose vocal tracts are longer or shorter than 17 cm will have different frequencies for these formants, but the pattern of 1x-3x-5x will be the same.)
By changing the vocal tract away from a perfect tube, you can change the frequencies that it prefers to vibrate at. That is, by moving around your tongue body and your lips, you can change the position of the formants.
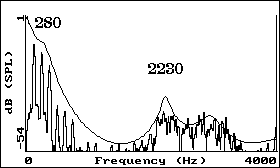
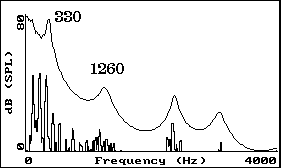
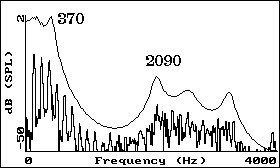
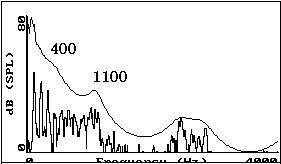
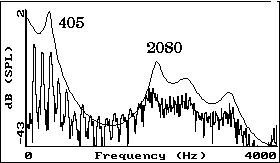
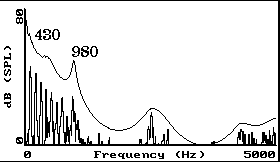
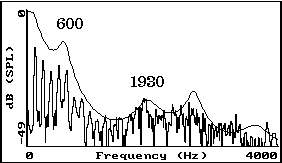
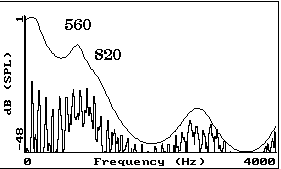
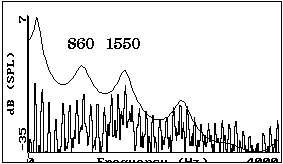
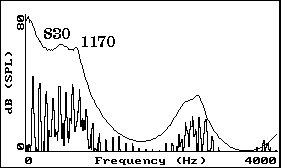
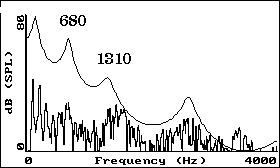
Each of the following figures shows a computer-generated spectrum and response curve for a particular utterance of a Canadian English vowel by an adult male (namely, me). The jagged lines show the harmonics. The curved line is the computer's guess as to what the frequency response curve of the vocal tract must have been. The frequencies of the first two formants (as guessed by the computer) have been given for each vowel.
| [i] | |
[u] | |
[ɪ] |
|
[ʊ] | |
| [e] | |
[o] | |
| [ɛ] | |
[ɔ] | |
| [æ] | |
[ɑ] | |
| [ʌ] | |
| Vowel | [i] | [ɪ] | [e] | [ɛ] | [æ] | [ɑ] | [ɔ] | [o] | [ʊ] | [u] | [ʌ] |
| F1 | 280 | 370 | 405 | 600 | 860 | 830 | 560 | 430 | 400 | 330 | 680 |
| F2 | 2230 | 2090 | 2080 | 1930 | 1550 | 1170 | 820 | 980 | 1100 | 1260 | 1310 |
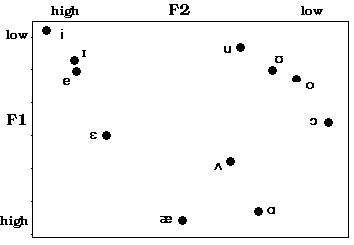
We can place each vowel on a graph, where the horizontal dimension represents the frequency of the first formant (F1) and the vertical dimension represents the frequency of the second formant (F2):
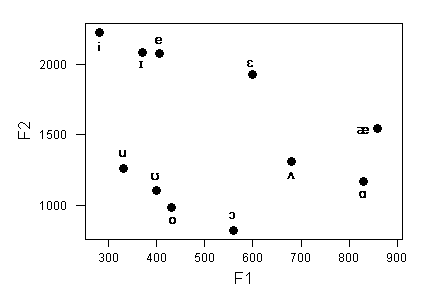
This is just a mirror image of our familiar vowel chart! If we change the axes of the graph so that the horizontal dimension shows (decreasing) F2 and the vertical dimension shows (decreasing) F1, we get something almost exactly like our vowel chart:
The frequency of the first formant is mostly determined by the height of the tongue body:
The frequency of the second formant is mostly determined by the frontness/backness of the tongue body:


