TFA: Two-factor ANOVA
(Keppel and Zedeck 1989, pp 183-196, 536-541; Manly 1997, pp 125-131; Zar 1999, pp 248-250.)
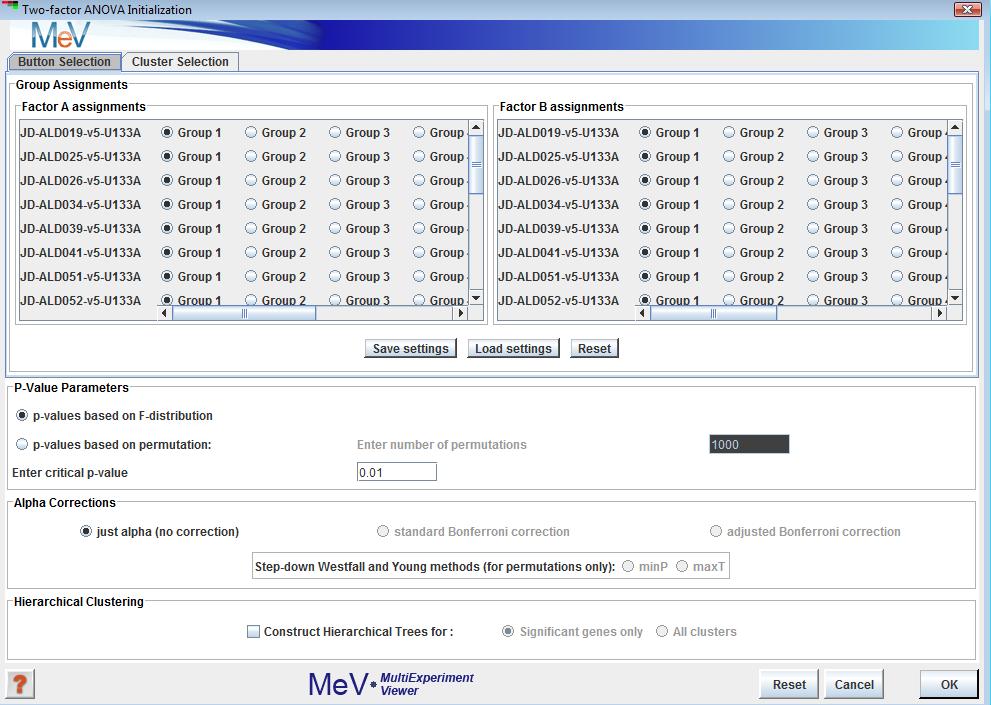
Two-factor ANOVA can be used to find genes that vary significantly across levels of two independent variables (factors), as well as their interaction. The first initialization dialog prompts for the names and number of levels of the factors, following which an initialization dialog very similar to that for t-tests and one-way ANOVA is displayed. The only difference is that the top panel of this dialog contains two sub-panels instead of one for group assignments:
The p-value parameters and alpha corrections (not yet implemented) are similar in function to the corresponding features in t-tests and one-way ANOVA. The cluster views in the output are similar to those of most other modules. Table viewers display the annotation, F-values and p-values of genes. Two or three p-values are generated for each gene: one each for the effects of the two factors, and an interaction p-value if relevant (see below). A significant gene cluster is generated for each significant effect. F-values and p-values are saved when clusters are saved as text files from the right-click menu on any viewer.
A few points should be kept in mind while running this analysis:
- Optimally, there should be equal numbers of samples in each cell (i.e, for each factorA - factorB combination). If samples sizes in cells are unbalanced, F-tests are biased, the degree of bias depending on the amount of imbalance. In such a case, the F-tests might be evaluated at a more stringent critical p-value than the one originally intended.
- Unbalanced designs, as described above, can occur in two ways: (1) by initially specifying the factor assignments in such a way that they are unbalanced, or (2) due to missing values for a gene, so that even if the original assignments are balanced, some cells have missing values for the gene.
- F-tests using the F-distribution (as opposed to using permutations) are quite fast.
- However, missing values in the expression matrix will greatly slow down permutation tests. The reason for this is, if a gene has missing values, it has to be permuted individually. In the permutations, values are randomly reassigned to cells, making sure that the missing values remain in their original cell. As each gene has to be permuted one a case-by-case basis, the total number of permutations will be (number of genes with missing values)*(number of permutations).
- On the other hand, for those genes that have complete data, the columns of the expression matrix are permuted, and all of the permuted F-values for those genes are computed at one go in a given permutation. Thus, the computation time for permutation tests is orders of magnitude less for a complete matrix than for one with significant numbers of missing values.
- Thus, the ideal data set for this kind kind of analysis would be one with balanced factor assignments, and no missing values (if you want to do permutation tests).
- Designs with just one sample in each factor A-B combination (cell) are also handled; however, in this case, only the A and B factor main effects are tested. Interaction is not tested in this case.
- Unbalanced designs where one or more cells have only one sample, or no samples, are not tested for any effects.
