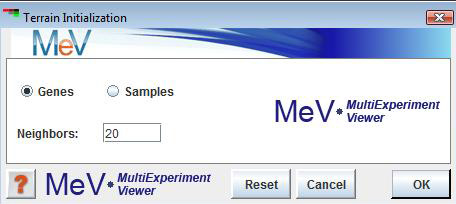
Terrain Map Initialization Dialog
(Kim et al. 2001)
Terrain maps provide a three dimensional overview of the major clusters inherent in the data. Terrain maps can represent gene or experiment groupings depending on the mode selected in the input dialog. The input elements are first mapped into a two dimensional grid in which the placement of each element is influenced by a user selected number of nearest neighbors.
It is very important to note that like many algorithms TRN uses a default distance metric that greatly affects the outcome of the terrain created. The default metric for TRN is Pearson Squared, which groups elements based on correlation and tends to place strongly correlated and strongly anti-correlated elements in similar groups. Explicit selection of Euclidean distance can sometimes reveal more obvious groupings. See the distance metric appendix, for more details on available metrics in MeV.
Data element identification can be achieved by four major methods. The right click menu allows one to turn on labels. The utility of the labels depends on how close the elements are to one another. It is also possible to move the mouse cursor over an element and reveal the annotation label currently selected in the main menu ( submenu). A third option is to click on an element, which will open an element information table listing annotation for the selected element. The fourth option is to select one or more elements in an area and either write them to a file or open a new mev session with the selected elements. Details about element selection are provided below.
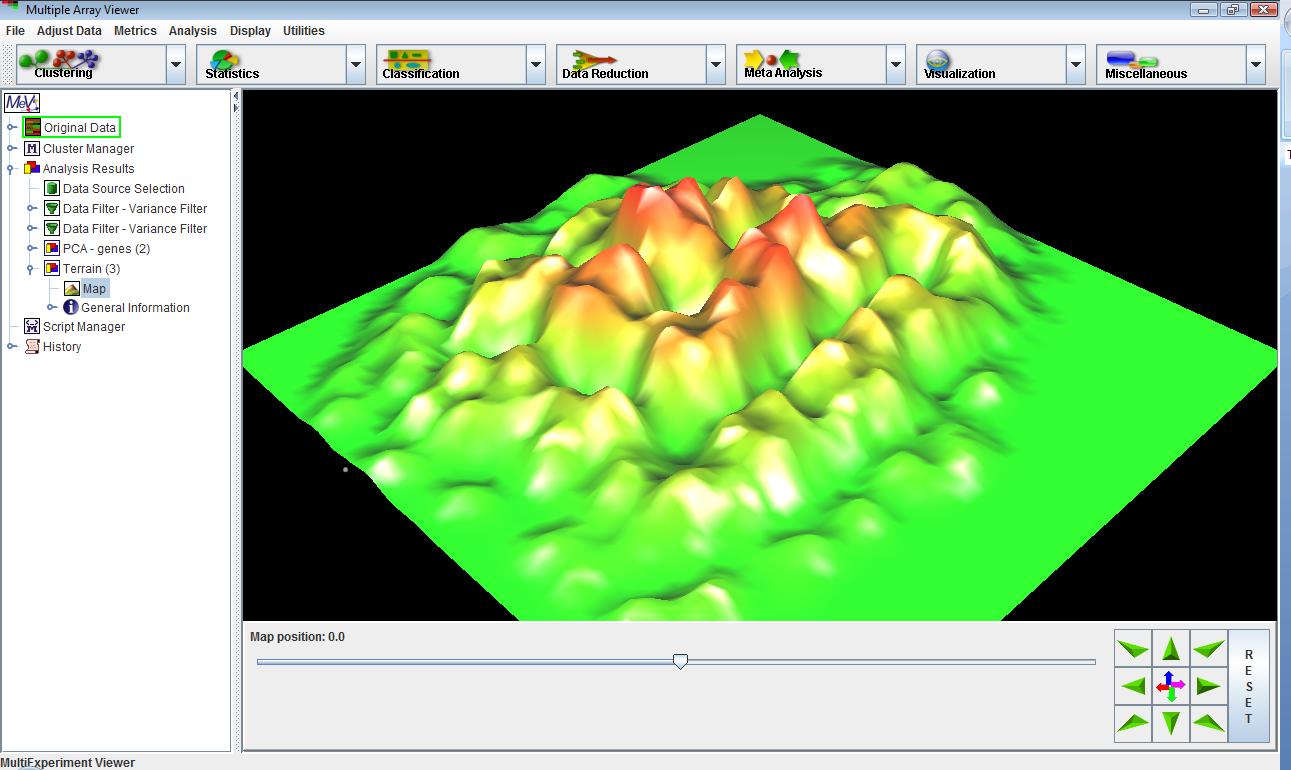
The main visible controls below the terrain view are related to navigation through the terrain. The navigation panel consists of nine buttons that will alter the point of view (pov) relative to the terrain. There are three major navigation modes for moving through the terrain viewer. Each mode is selected by clicking on the center square of the navigation control.
This mode selection is indicated by the four strait arrows icon in the center of the navigation control panel. The arrow buttons move the point of view relative to the terrain in predictable strait line movements. The up and down arrows move the pov higher or lower relative to the terrain. The upper left and right arrows move the pov directly toward the terrain view while the lower right and left arrows move the pov directly away from the terrain. The left and right arrows move the pov left and right relative to the terrain.
This mode controls the pitch angle and roll of the pov relative to the terrain. The corner arrow buttons make the terrain roll about the center point of the viewer. The left and right force a banking motion and the up and down arrows control the pitch or angle of view.
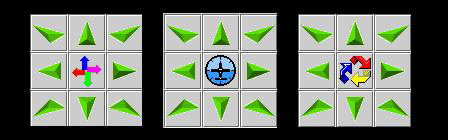
This mode forces rotation of the terrain about a central point in the terrain. The up and down buttons tilt the terrain toward and away from the pov. The left and right button forces the terrain to rotate about the central point while staying constant relative to the horizon. The corner buttons permit a tight rolling motion of the terrain relative to the pov.
This moves the data points up and down relative to the terrain. Sometimes it is preferable to have the points higher than the terrain to view the distribution.
The terrain viewer has a right click menu providing several options for altering aspects of data presentation and for extracting information such as gene lists. Each option is describe below.
Control Panel
This option determines whether the navigation control panel is visible or not.
Grid
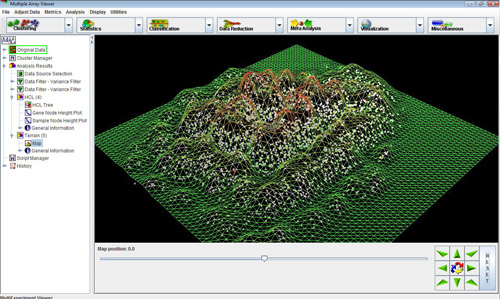
The Grid menu item permits the selection of the terrain’s resolution or smoothness. Reducing the grid value can sometimes improve viewer response by saving computational expense on the computer. Lowering the grid value will render the terrain as a series of planes.
Fill Polygon
This option alters whether the terrain’s surface is render or if simply the outline of adjacent planes. Like the Grid option deselecting this can produce faster rendering of the viewer during navigation.
Element Shape
Three optional element shapes are supported, point, cube, and sphere.
Labels
Labels can be displayed or hidden. If displayed there is a billboard option to help render the labels such that they can be seen from the current point of view. Note that if identification of a cluster of elements is desired the best way to verify is to select the elements and store them as a cluster or launch a new viewer containing the elements. Both options are described below.
Links
Elements passing at threshold criteria can display a link between the points. The links menu option allows the user to display or hide displayed links between elements passing the threshold criteria. Within the links menu the current threshold can also be set in order to visualize the strength of the associations within element groupings. The thickness of the links is also adjustable from 1 to 10 on a relative scale.
Drift (Auto-navigation Control)
Flying through the terrain to a selected point on the terrain or a data element is performed by holding down the on the desired destination. The point of view will automatically navigate to the destination. If the selected destination is a point on the terrain such as a peak or a plateau the point of view will orient such that the view is orthogonal to the plane on the terrain that contains the destination point. This can be useful to quickly get to a top down view when clicking on flat areas between peaks. If the selected destination is a data point, the final point of view on the element and in the plane containing the data elements. The route will move toward the element and attempt to orient in a position to more easily read the label associated with the element. Some further navigation may be required to avoid elements that may obstruct the element of interest.
The menu option permits entry of a relative distance parameter that can range from 0 up to but not including 1.0. This represents the final distance between the point of view and the destination when drifting. Small values will cause the drift auto-navigation mode end position to be close to the destination and is often preferred when visiting a specific data element.
The following four options are only enabled if a group of elements has been selected in the selection area. Points are selected by holding down shift and dragging the mouse in the viewer. Once selected the following options are enabled:
Store Cluster
The store cluster option will store the elements in the selection box in the Cluster Manager. The clusters in the repository are viewable in the cluster table and if incomplete selections are made in TRN, several clusters can be made and then joined (Union operation) in the cluster table to capture all of the desired elements.
Launch New Session
This feature launches a new Multiple Experiment Viewer containing the selected elements. This is perhaps the fastest and most convenient means of viewing the selected elements. An alternative to this is the Show Selection option described below.
Deselect
This option dismisses the selection area.
Show Selection
This option shows the selected elements within a small window. Note that the window supports the selection of multiple elements using shift-click or ctrl-click and the list can be copied and pasted into other applications by ctrl-c.