Expression Images Viewer
Viewers are the graphical displays used by MeV to present the results of the modules’ calculations. The viewers will appear as a subtree under the module’s Result Tree within the main navigation tree. The viewers listed here are those which are used by more than one of the MeV modules. Custom viewers, used by only one module, are described in that module’s section.
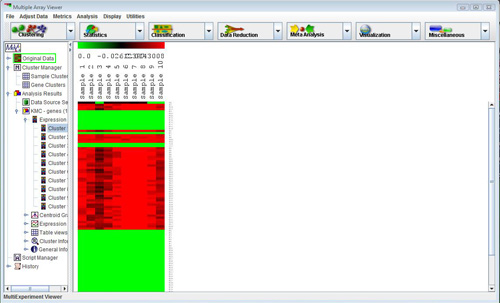
This viewer is used in the main window of the Multiple Experiment Viewer as well as in most of the modules. It consists of colored rectangles, representing genes, in a matrix. Each column represents all the genes from a single experiment, and each row represents the expression of a gene across all experiments. The default color scheme used to represent expression level is red/green (red for overexpression, green for underexpression) and can be adjusted by selecting

Clicking on any of the rectangles in this view will open a window reporting information for that spot. This window contains a great deal of information, including expression values and row/column coordinates.
This viewer displays graphs of the expression levels of each gene across the experimental conditions. By default, the line color is gray or colored according to the cluster membership.
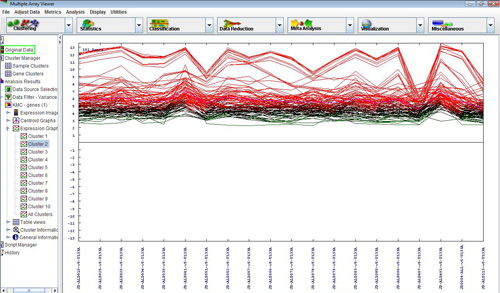
The mean expression levels of genes in the cluster are shown as a centroid graph overlaid on top of the individual expression graphs. Each line represents the graph of an individual gene, and combined they created the whole centroid graph. The red line represents the graph of the mean of all the genes across the samples. If you previously saved and color coded your clusters, those colors will appear on the graph if you turned on the feature. This allows you to see the patterns, if any, of the behavior of the genes across the samples.
By default, the range of the Y-axis for an expression graph is the same for each viewer produced from an analysis, regardless of which subset of expression graphs is displayed. The X-axis (y = 0) is centered on the Y-axis, and the Y range is set to the distance of the element in the entire data set which is furthest from zero. Use the option in the right-click menu to change the Y range to the maximum distance from zero only for elements within the current expression graph. This option allows the expression graph to expand to increase the resolution of expression changes within a particular cluster.
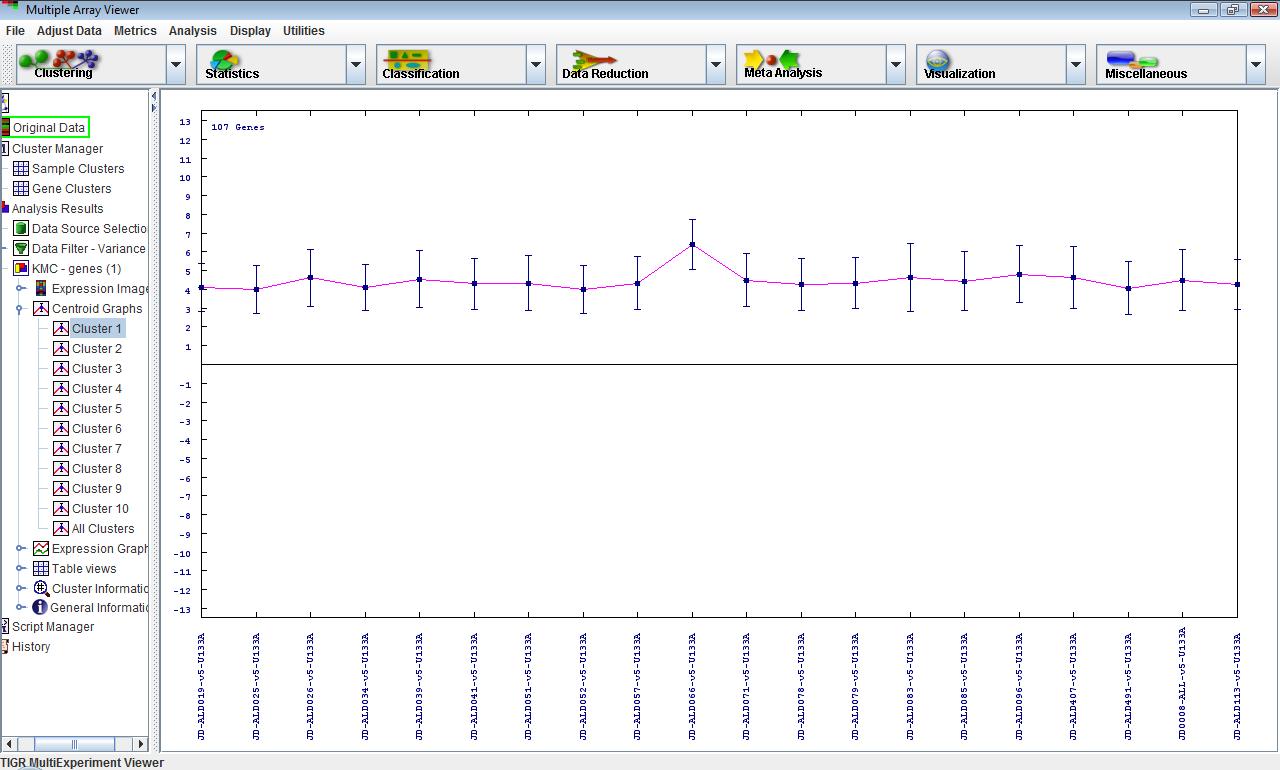
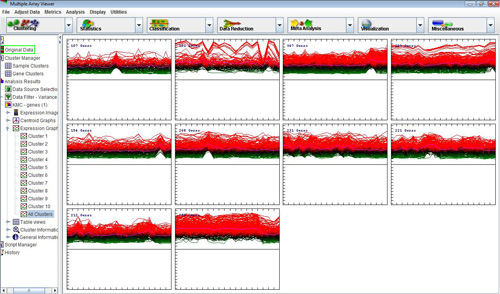
This viewer is very similar to the Expression Graph Viewer, except that line graphs for individual genes are omitted, leaving only the centroid graph. Error bars represent the standard deviation of expression within the cluster. That is, the mean for all the genes of a sample is represented by a dot, and the standard deviation for the genes in that sample are shown above and below it. In fact, the red line connecting the centroids is the same red line as in the expression graphs.
These views show element annotation and, where appropriate, auxiliary information such as element-specific statistical information for the elements in a cluster.
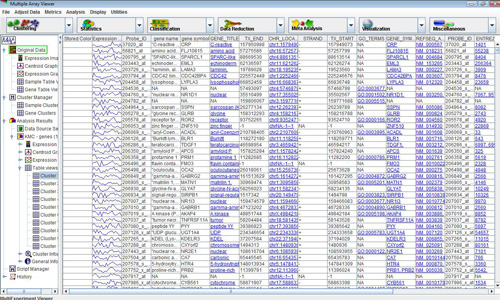
Columns can be dragged horizontally across the table to change their relative ordering. Successive clicks on the header for any column will sort the rows in ascending or descending order of the entries in that column. Sorting of the “Stored Color” column will bring together elements that have been stored with the same cluster color. CTRL-clicking on any column header will sort the table in the original order of elements in that cluster, an option that is also available from the right-click menu (below).
Left-clicking on any of the blue-underlined cells in the table will launch a web browser and display the contents of that cell in a web page appropriate to the type of annotation contained within it. The mappings that determine which web site MeV will attempt to access for each annotation type can be changed my modifying the appropriate configuration file. A template for this file can be found on the TM4.org website, at http://www.tm4.org/mev/annotation_URLs.txt.Simply download the file and modify it to contain annotation name / URL mappings you wish to use. These mappings will the default mappings MeV uses. Load the file using the option from the main MeV toolbar. The name and location of this file will be saved in MeV’s user preferences file, and re-loaded in subsequent sessions.
Right-clicking on the table view brings up a menu containing the options available from the right-click menus of other types of viewers, with a few important modifications. In addition to storing the entire cluster and launching the entire cluster as a new MeV session, as in the other types of viewers, users can also select a subset of rows in the table for these operations. Even individual elements can be stored and tracked one at a time. Contiguous row selections can be made by dragging the mouse over these rows, or by selecting the first row of the interval and then SHIFT-clicking on the last row of the interval (in Windows). Non-contiguous rows may be selected by CTRL-clicking on the desired rows.
To delete a cluster stored from this viewer (i.e., either all the rows in the table or a subset of them), select the rows corresponding to the stored cluster and choose the “Delete …” option on the right-click menu. Please note that for successful deletion, the stored cluster should have been created within the current algorithm run that the table view belongs to, and the row selection should exactly correspond to the rows in that cluster.
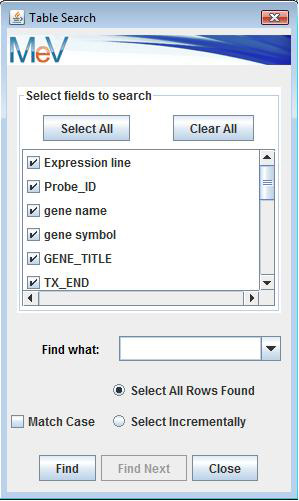
The “Search” function on the right-click menu pulls up a search dialog, as shown to the right:
Users may search any combination of columns for specific terms. Other options on this dialog are self-explanatory. The option allows users that are connected to the Internet to launch a web browser to open a page related to the selected gene. First select a gene of interest (a row) and then click on the annotation key to use as the gene identifier. MeV will attempt to construct a URL for the selected annotation key by checking a URL configuration file. If it is unable to definitively decide what the selected annotation type is, a dialog will be presented to allow you to select an annotation field name (column header name) and an external resource to open.
Within the directory there is a file () that contains entries to support this feature in MeV. This file can be modified with new external resources as needed, and the existing fields can also be modified, with the exception of the UniGene field (see below). The file is arranged such that each row represents a different annotation label:resource pair with the following tab delimited fields (\t indicates a tab).
Annotation Label \t URL \t Resource Name
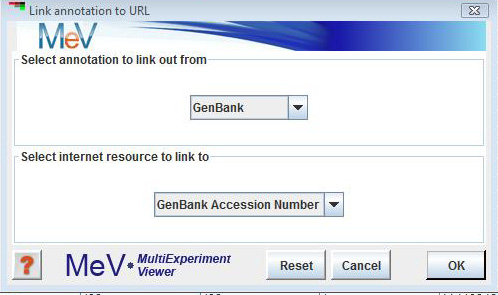
The Annotation Label indicates the name of the annotation field that is loaded into mev. This is in the header of the annotation file or TDMS file. For example, if in some files you call GenBank GB# and in other files it is referred to as GenBank then two entries in this annotation/url file can be made, one for each key. If an input annotation file had the GenBank numbers identified as gb# then the Annotation/URL Association dialog would launch to allow you to manually indicate the desired external resource.
The URL entry is the URL for the resource. Look in the file for examples. It is important to note that the URL has a section labeled ‘FIELD1’. This is a placeholder to indicate where the gene identifier should go when constructing the URL. The UniGene URL is the only exception, requiring two variable fields called FIELD1 and FIELD2, which are parsed out of the UniGene identifier. The UniGene Annotation Label is required in the file to correctly parse UniGene Ids; therefore, please do not modify this line.
Venn Diagram
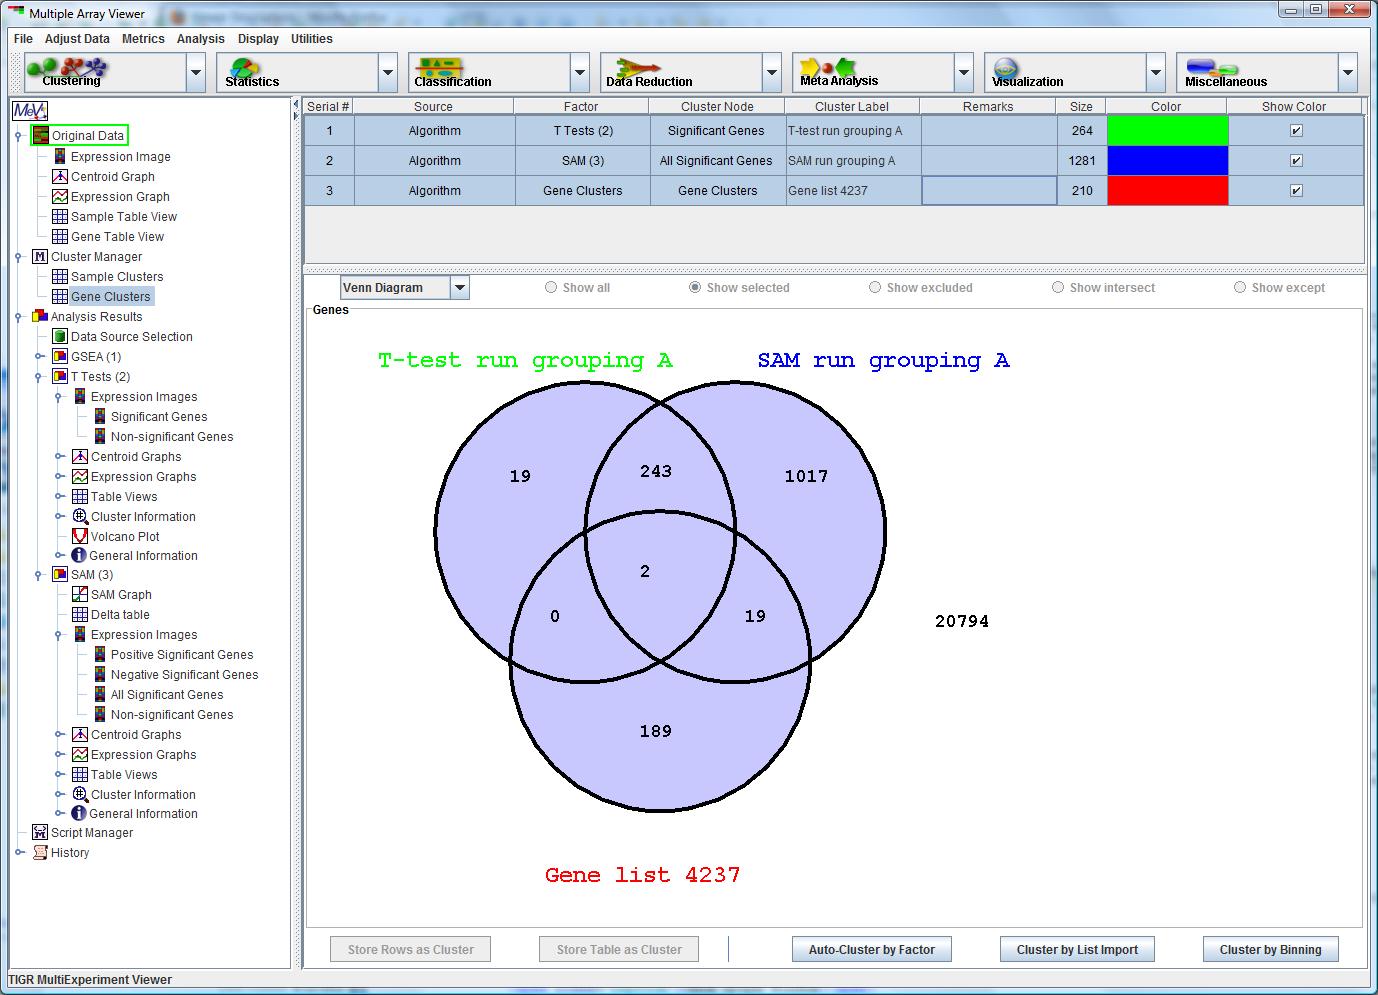
This viewer is used in the Cluster Manager only. The viewer allows for the comparison of two or three clusters to determine the degree of overlapping cluster membership. Each two cluster viewer calculates a p-value associated with the relationship. The p-value represents the likelihood of an equal or greater overlap given the null hypothesis that the clusters have no relationship to one another.
Clicking on any of the circles in this view will highlight that. Right clicking allows for all the elements within that region to be stored as a distinct cluster. Outlines surrounding the circles are color coded according to the relative weight of each circle on the selected area of interest. Blue implies an excluded rule and red implies inclusion.
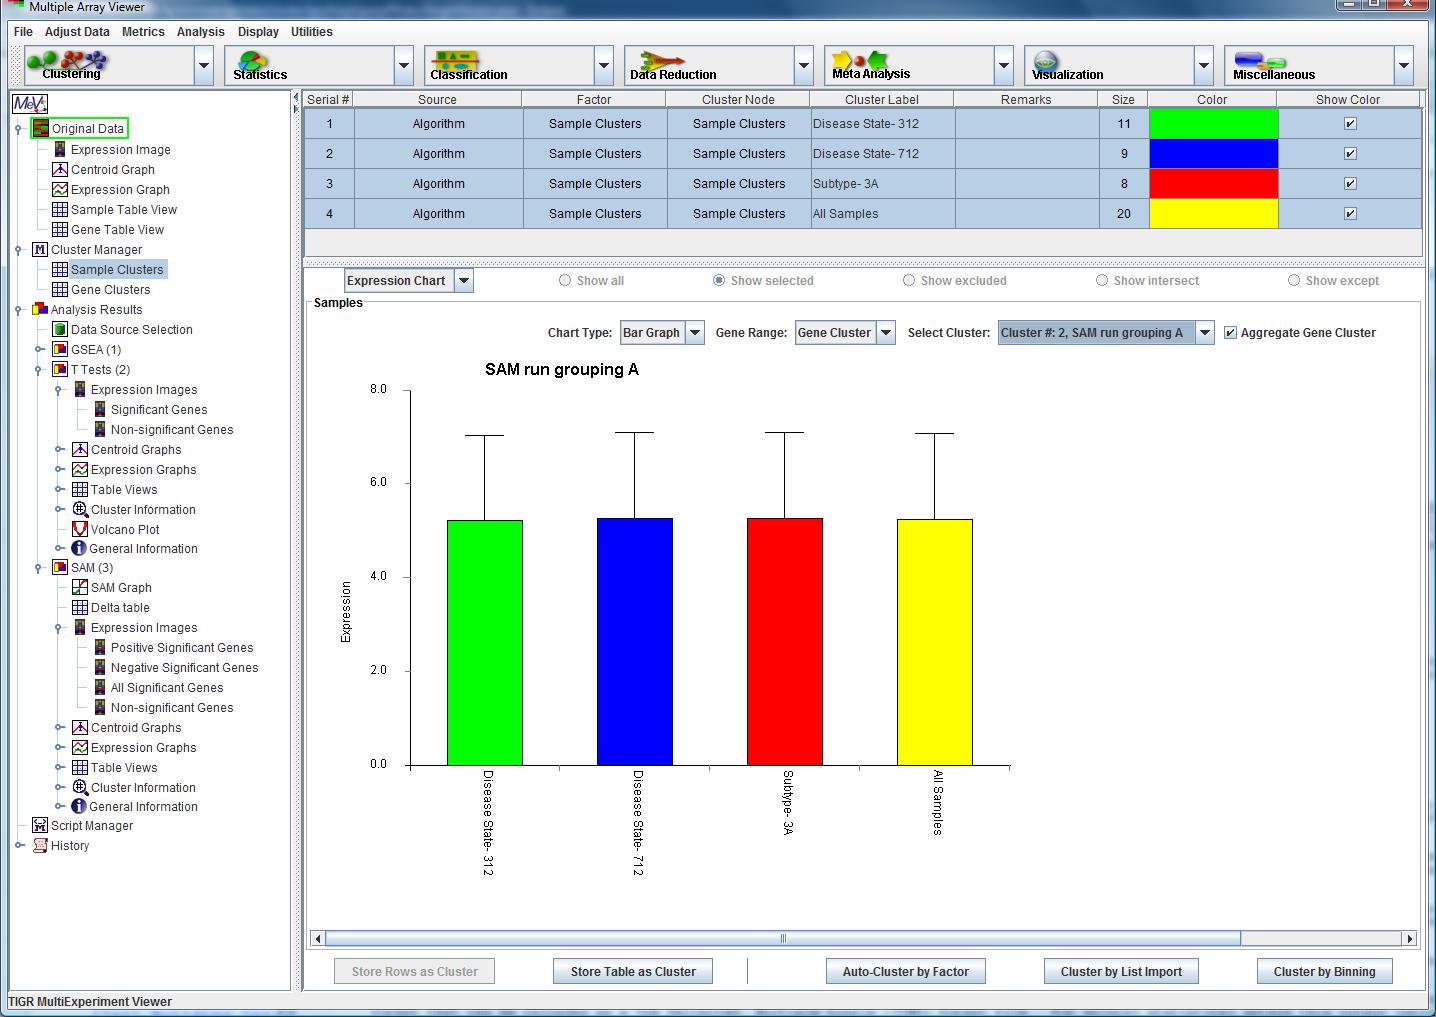
Expression Charts
This viewer is used only in the Sample Cluster Manager. The purpose of this viewer is to visually display a consolidated graph of expression data over a defined subset of the data. This data is expressed in either box plot form or bar graph form, as defined in the drop-down box labeled "Chart Type". For each chart, the data range is defined over a single gene or a set of genes held by a Gene Cluster. This range is user-specified in the "Gene Range" drop-down menu. Sample clusters are included in the view by highlighting and are displayed along the x-axis as distinct subsets for easy visual evaluation.
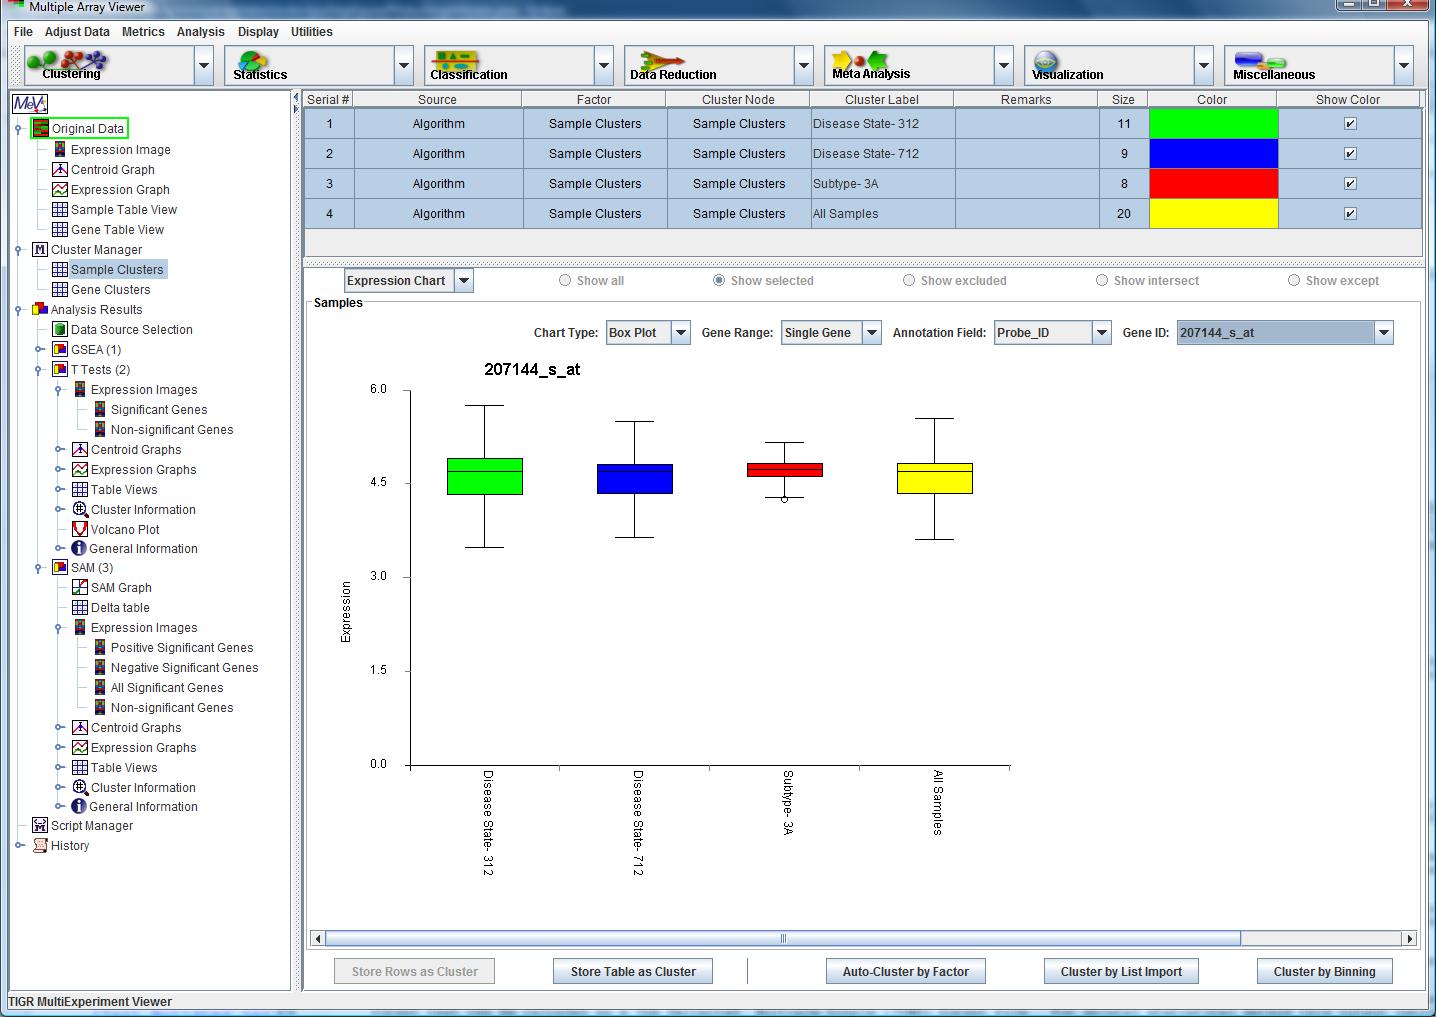
When using the Gene Cluster option for the range, users have the ability to viewer the cluster consolidated into a single chart or displayed as individual gene charts built vertically. The "Aggregate Gene Cluster" checkbox facilitates this option. When in the expanded mode, scrolling down shows the relative changes across sample clusters or genes within the selected cluster.
A right click within most result viewers will launch a menu that is specific to the currently displayed viewer. Some of the viewer specific options, such as searching in Table Viewers have been discussed however there are several common viewer options that are shared among the common viewer types.
The Store Cluster option will save the currently viewed cluster to a cluster manager. This feature will be described in detail in section 8. The main use of this feature is to assign a color to the elements in the cluster so that the location of the marked elements in future results can be assessed.
The Launch New Session option takes the elements in the current viewer an opens a new multiple array viewer with just those elements represented. This is useful for quickly extracting elements of interest and further characterizing their expression.
The Save Cluster option saves the currently viewed cluster to a file. The expression values and annotation for the current cluster are saved in a format that can be reloaded as a Tab Delimited, Multiple Sample (TDMS) format file. For several statistical method this output includes statistics such as F-values or T-values, and p-values depending on the particular statistical algorithm applied.
This saves all clusters from a clustering result as described above but where the file name has a cluster index appended to indicate cluster id.
This method is used if the Store Cluster method has been used to store the cluster to the repository. This is a remote method to remove the cluster from the repository. The cluster table viewer in the cluster manager also has a means to remove single or multiple clusters.
Choose this option to broadcast the entire contents of this viewer to the Gaggle network. To broadcast to a specific goose, choose that goose from the menu. More details about the Gaggle network are available in the section x of this manual.
The same as , but broadcasts values only for the table rows that are currently highlighted.
Broadcast the annotation of the genes displayed in the current viewer to the Gaggle network. The annotation values that are currently displayed in the viewer will be sent to the goose selected in the menu in the menu.
The same as , but broadcasts names only for the table rows that are currently highlighted.