Sample Label Editor
The graphical display of data and analysis results is one of MeV’s strongest assets. This section of the manual describes options that include selection of gene and sample annotation to display, adjustment of expression image color schemes, and adjustment of expression image element size.
Samples in MeV can be labeled in various ways to indicate natural groupings based on experimental design. By default, samples are labeled with the file name or in the case of TDMS format files the names are in the header row. Sample labels can be select by choosing Expression images and expression graphs will label the samples by this selected annotation field. TDMS format files can contain additional sample annotation as described in the file format appendix. Two other options for providing additional sample annotation are to select or to use the Sample Label Editor as described below.
The Sample Label Editor is launched from the menu option. One key point is that if samples names are added, merged, or if samples are reordered, the changes can be captured by selecting from the main menu . This will save the loaded data in to a TDMS file and will preserve the added sample annotation and sample order, if altered.
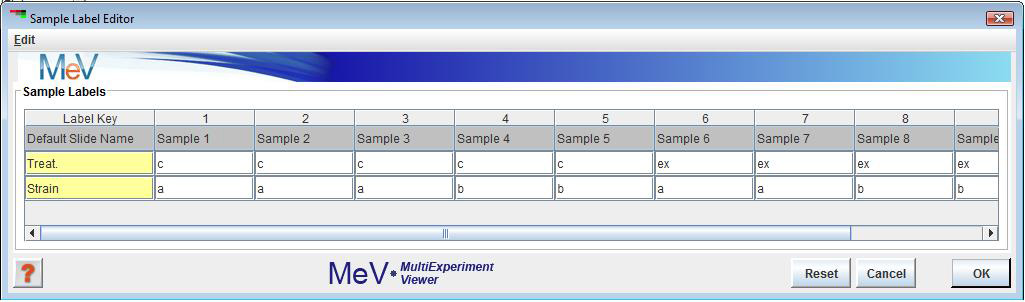
The primary function of the Sample Label Editor is to permit the modification of labels (attributes) associated with the loaded samples. Note that the first row in the table contains the default sample name. The Default Name cannot be edited nor can it be deleted. The second major function is to enable the order of loaded samples to be rearranged. Two menus are available within the editor frame for performing editor actions. The two menus contain the same menu options. One is in the main menu bar and the other is available using a right mouse click with the mouse cursor over a table cell. **Note that the import of additional sample annotation can be done using the option from the .
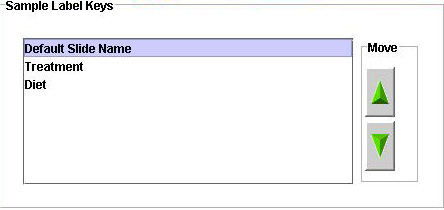
The order of the columns in the table can be altered by clicking on the column header and dragging the column to the desired location. This action alone does not force the loaded data to be reordered. The table order can be imposed on the loaded data if the check box menu item is selected to . This ordering is imposed as soon as the dialog is dismissed.
The menu item is used to create a new row in the table. Note that the first cell in the new row is light yellow and is used to indicate a . This key will be placed into the menu in the menu so that when selected this label type will be displayed for the loaded experiments. Once a Label Key is entered, a double click on the remaining cells will allow editing to add appropriate labels for each sample. Reopening the editor will allow you to alter any label or label key visible in the table except for the default primary label and key (shown in gray). Blank entries are allowed.
Occasionally it is convenient to merge several attributes or labels to produce a more informative label for each sample. To merge labels start by selecting two or more rows using ctrl-left click and then selecting the menu item. A small list will be presented that can be used to order the selected labels before actual merging. Once attribute ordering is done, a new row is inserted in the table to display the merged labels and the merged label key.
The menu option from the menu is used to select a gene annotation field from among the loaded annotation types. Expression image viewers and other viewers that display gene annotation will be adjusted to display the selected annotation type.
The color scheme selection options pertain to the color gradients that are used to correlate color to an expression value for an element in expression viewers.
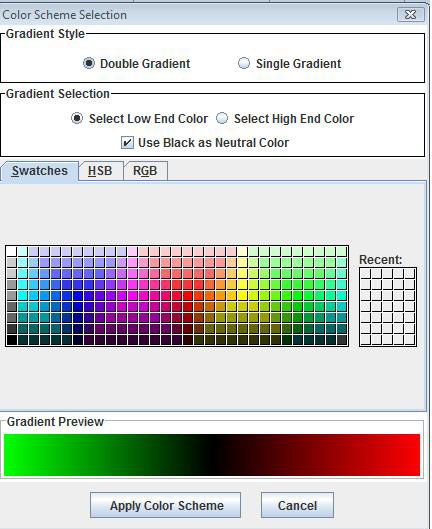
Custom color schemes can be created by selecting Color Scheme-->Custom Color Scheme. The form will provide several options:
Gradient Style: Allows the selection of a double gradient or a single gradient. In some cases a single gradient is preferred if values are not compared to a reference.
Gradient Selection: This panel selects the endpoint color that is being selected and allows for the center color on a two gradient scheme to be black or white.
Color Selector: This area presents controls for selecting endpoint colors.
Gradient Preview: This area displays the current settings.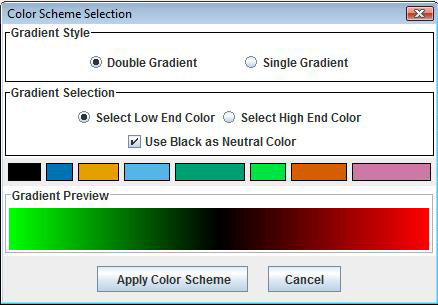
Color Scheme Selection dialog for the Accessible color scheme
The Accessible Color Scheme was developed to make the images that MeV generates accessible for people with the color blindness. The color palette contains eight colors adapted from the web based resource:http://jfly.iam.u-tokyo.ac.jp/color/index.html.
The Color Scheme Selection dialog (shown below), which appears when you select the option from the menu; provides choices similar to the option (Gradient Style, Gradient Selection, Color Selector and Gradient Preview).
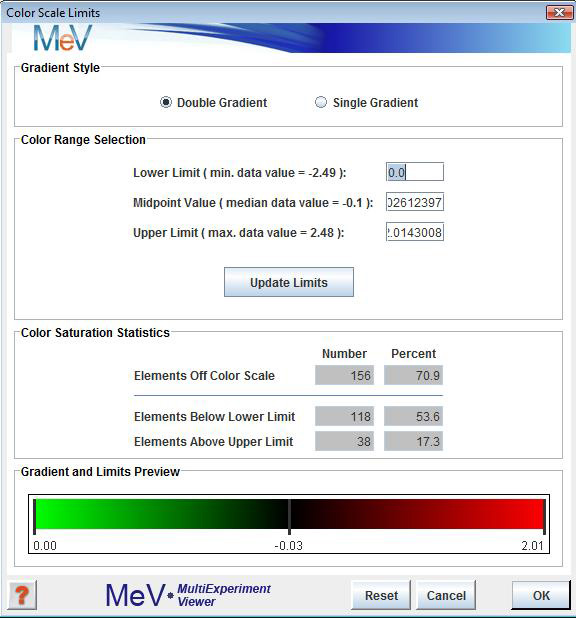
Expression images convey expression levels by converting the numeric expression value (log2(A/B) or absolute expression value) as a color that is extracted from the color gradient. By setting numeric limits or endpoints on the displayed gradient (seen in the preview panel above and at the top of expression image viewers), expression values within the limits can be displayed as a color selected from the gradient image. The option from the menu provides a dialog to set the limits of the color gradient.
The controls are used to select to use either a double gradient such as green-black-red or a single gradient such as black-red. The double gradient is most often used for two dye array systems in which the values are log2 ratios. In this case the mid-point is kept at 0.0 so that spots where the two channels have equal expression (log2(A/B) = 0) are depicted as black and spots where the expression is unequal will tend to be colored more toward the extremes. The double gradient might also be useful for single dye systems where a reference or median value is used to generate a log2(I/Ref).
The single gradient option is useful for single channel data where data falls over a continuum and there is no clear rationale to separate the data into two distinct color regions.
The color scale limits dialog, like the color scheme dialog also provides the choice of using a double or single gradient as appropriate.
The panel provides input boxes to set lower and upper limits for the color gradient and a midpoint when using a double gradient. The labels next to the input boxes display the minimum, maximum, and median expression values as a rough guide when setting color scale limits. When the button is pressed the panel (below) and the gradient preview panel are updated. The limits are also conveyed to MeV and the current viewer is updated to reflect the limits. This permits you to adjust and update the limits while viewing the affect of the new limits on the expression image.
The panel displays the number of spots that are beyond the limits of the color scale. These elements would be represented in the expression image as the saturated endpoint colors. This panel also reports this information as a percentage of elements that are saturated relative to the total number of elements. These numbers allow you to adjust the limits such that the expression is spread across the gradient with a limited number of saturated (off scale) elements.
The reset button of this dialog will reset the limits in the dialog to the original limits present when the dialog was opened and MeV has it’s limits rolled back to the original limits.
The final two options in the Display menu are options to alter the element size and to draw or omit borders around each element. Element size can be selected from among four preset options or a customized size can be selected by entering an element height and width.