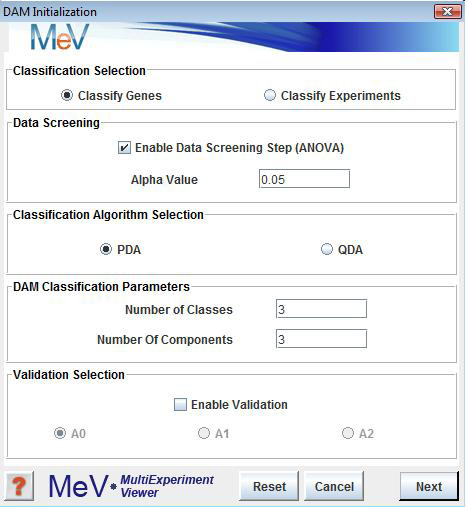
DAM Initialization Dialog
(Danh V. Nguyen and David M. Rocke, 2002)
DAM is a method for classification of genes/experiments into more than two groups or classes. DAM incorporates a gene dimensional reduction method, Multivariate Partial Least Squares (MPLS), and two classification methods, Polychotomous Discriminant Analysis (PDA) and Quadratic Discriminant Analysis (QDA). Either PDA or QDA can be performed after MPLS depending on the user’s selection. A three-dimensional plot of the most significant gene components is generated and displayed in the DAM results viewer.
The panel provides two options for DAM: classify genes or classify experiments.
The panel allows the users to select to apply a filter to select genes (or samples if classifying genes) from the loaded set that should be near optimal for partitioning the elements to classify based on Analysis of Variance (ANOVA) on permutations of the known (training) class members. The list of selected elements and number of selected elements will be reported after classification and the alpha value can be adjusted to apply a more or less stringent criterion and will impact the number of elements selected to enter the classification algorithm.
The panel is for selecting either between PDA and QDA as the primary classification algorithm.
The panel panel has fields to enter the number of expected classes that should be found. The data will be partitioned into this many classes. The indicates the number of representative expression vectors that should be generated from the data using MPLS.
The panel allows the user to select if validation should be performed and which assessment algorithm in A0, A1 and A2 are to be used in validation. The algorithms are described in the cited DAM reference and briefly in the information help page that is launched when from the information button in the lower left corner.
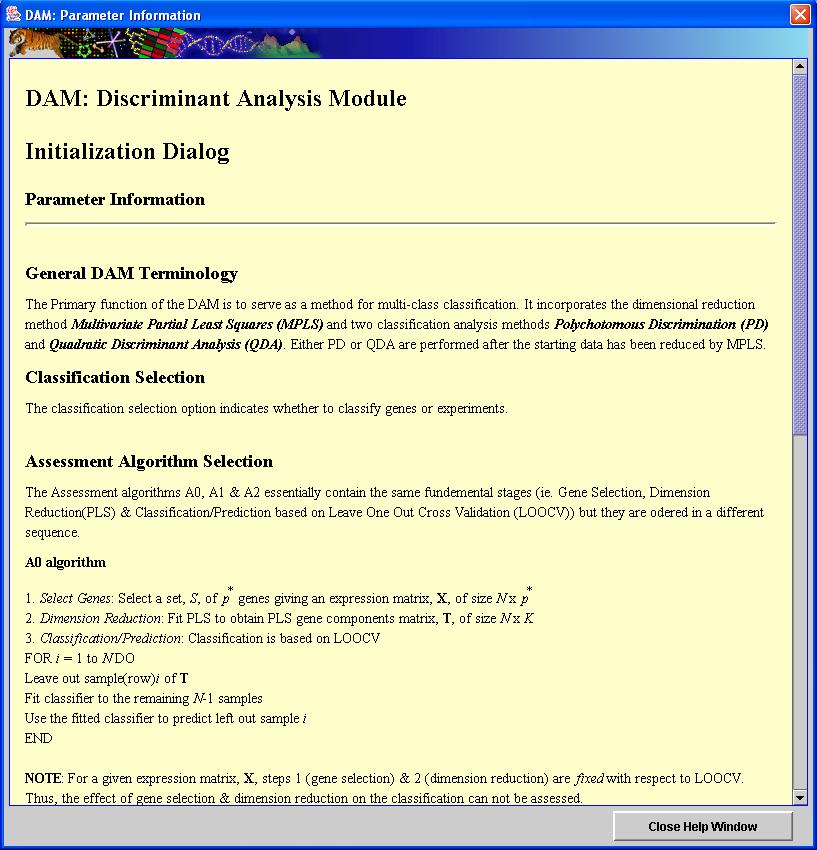
When the Information button at the bottom-left corner of the DAM Initialization Dialog is depressed, an Information Dialog screen is popped up. This Dialog contains brief description of the terminologies in DAM, and references page describing the methods and parameters used in DAM.
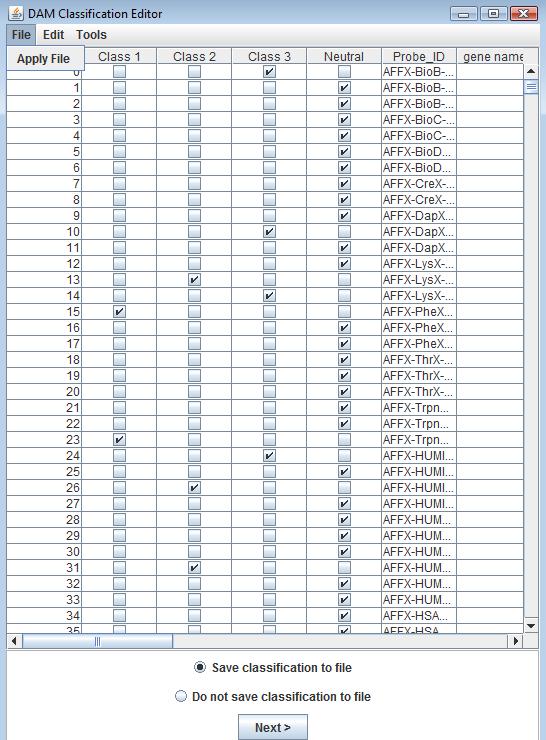
When the button is depressed from the initialization dialog, a DAM Classification Editor screen shall pop up. This screen allows the user to identify which samples are known examples of a class and to which class they should be assigned. Samples that are left as are assumed to be of unknown classification and will be partitioned based on the known members of the class using the selected algorithm and parameters. Note that the default is to save these selections to a file when exiting the editor. If the settings have been set previously and saved you can choose to load or apply those settings from the editor’s File menu. This will apply the saved settings but you will still have the ability to alter class memberships before proceeding.
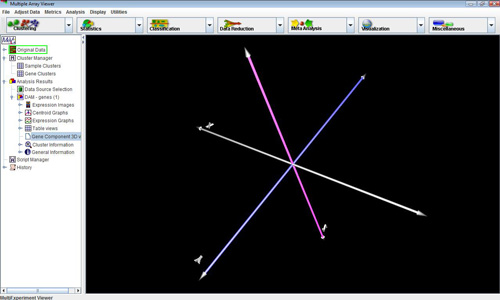
When the DAM module has run to completion, a sub-tree labeled “DAM” will be created and placed under the Analysis tab in the navigation tree. The tabs within the DAM sub-tree contain results of the module’s calculations. The results include Expression Images, Centroid Graphs, Expression Graphs, Gene Component 3D view, Cluster Information and General Information. Of these viewers, all have been described previously except the Gene Component 3D view.
The Gene Component 3D view is a three dimensional view representing the 3 most significant gene components obtained from Dimensional Reduction. The display can be rotated and shifted by left dragging or right dragging respectively. Right clicking on the 3D view node will display a popup menu that allows the user to change the 3D view’s display options and create a selection area to define a cluster. The points are projections of the elements being classified into 3D space using the first three expression components generated during MPLS determination of representative components.