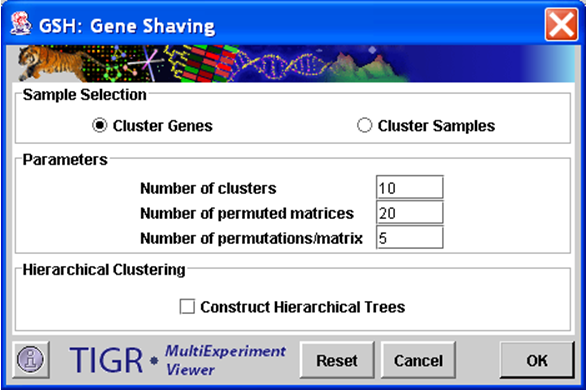
Gene Shaving initialization dialog.
(Hastie et al. 2000)
The clusters that are created by this method differ from the results of other clustering algorithms in several ways. Clusters are constructed such that they show a large variation across the set of samples and small variation between the expression levels of the individual genes. Each cluster is independent of the others and they may overlap other clusters; each gene may belong to several clusters or none at all. One particularly interesting feature of this algorithm is that it will associate genes whose expression levels change by a similar magnitude across experiments, but in the opposite direction. For example, a gene with a given expression pattern across a series of experiments will be clustered with other genes whose expression pattern is the exact opposite.
The sample selection option indicates whether to cluster genes or experiments.
Number of Clusters
This integer value indicates the number of clusters to produce. Note that in the GSH algorithm the clusters do not necessarily represent disjoint sets. Some elements may be represented in more than one cluster while other elements may not be represented at all.
Number of Permuted Matrices
This integer value indicates the number of permuted matrices used to generate an average R2 (measure of cluster variance) used to generate the gap statistic.
Number of Permutations/Matrix
This integer value represents the number of alterations to each permuted matrix produced to generate the gap statistic.
Hierarchical Clustering
This check box selects whether to perform hierarchical clustering on the elements in each cluster created.
Default Distance Metric: EuclideanThe first principle component of the expression matrix is calculated, and those genes whose variance is in the bottom 10% are removed. These two steps are repeated using the remaining genes until only one gene remains. This results in a series of nested clusters. One cluster is chosen from this series using the gap statistic (see below for details). The expression matrix is then orthogonalized, another series of nested clusters generated and one cluster chosen from it. The process is repeated until the number of chosen clusters reaches the number specified in the “Number of clusters” parameter.
The method used to select one cluster out of a nested series is maximization of the Gap Statistic. Randomized clusters are created from the existing expression matrix. The ratio of expression variance of a given gene between experiments versus the variance of each gene about the cluster average is calculated. The cluster whose ratio is furthest from the average ratio of the randomized matrices is chosen.
This module is computationally intensive, so it may be several minutes before results are displayed. The experiment subtree created by the module contains expression images, centroid graphs and expression graphs of each of the clusters predicted and the genes not assigned to clusters. It also contains a Cluster Information tab which reports the sizes of each cluster.