One convenient way to diagram a sound wave is to graph the pressure at each point in time, the way it might be picked up by a microphone for example:
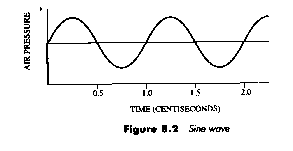
This simplest kind of pressure wave is called a sine wave.
Interesting things to measure for a sine wave:
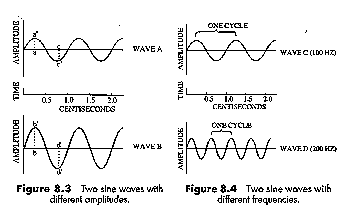
Wavelength is the converse of frequency: the shorter the wavelength, the higher the frequency; the longer the wavelength, the lower the frequency. (Sound will move at the same speed, about 330 metres per second. So if you want to double the frequency of a wave, you'll have to fit twice as many wavelengths into that 330 metres, and each wavelength will have to half as long.)
You can get the overall effect by adding the waves' pressures
together at each point in time. (You have to treat the normal
air pressure as zero, so that a higher pressure is positive and a
lower pressure is negative.)
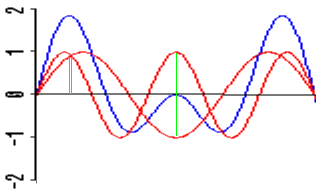
The two red waves added together produce the blue wave.
At the first green line, both red waves have high pressure and
reinforce each other to give an extra high pressure in the blue
wave. At the second green line, the two red waves have
opposite pressures and cancel each other out.
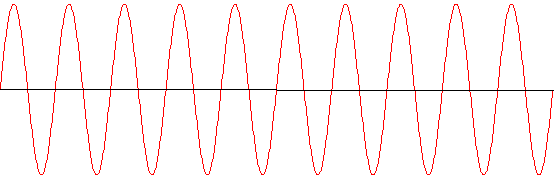
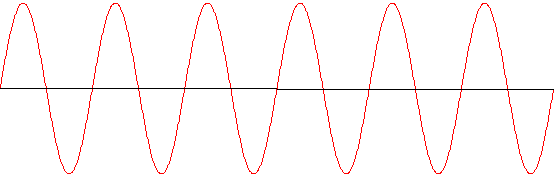
The following two sounds have frequencies of 300 Hz and 500 Hz:
 300 Hz
They can be added together:
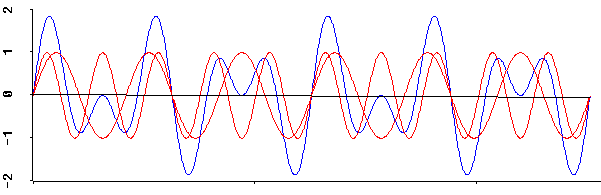
to produce a complex wave:
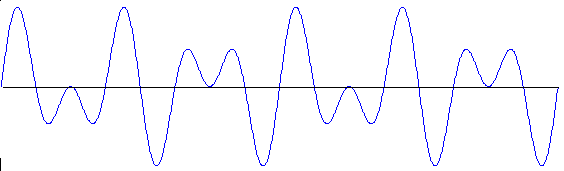
This is important because:
Any complex wave can be treated as a combination of simple sine waves.
We usually don't care about the actual complex wave itself. We're only interested in the frequencies and amplitudes of the simple waves that it's made up of. Two more examples:
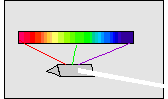
The set of frequencies in light wave (as separated by a prism) is called its spectrum.
Scientists can identify different substances by looking at the spectrum of the light the substances emit when they're heated. Iron will glow with a different set of frequencies than nickel or sulphur.
The situation is similar with sound. The complex wave for an [i] will be composed of a different set of frequencies than the complex wave for [a].
We need a way to separate a complex sound wave out into its
component frequencies (and their amplitudes) so that we can see
what makes vowels different. A spectrograph is
essentially just a prism for sound.