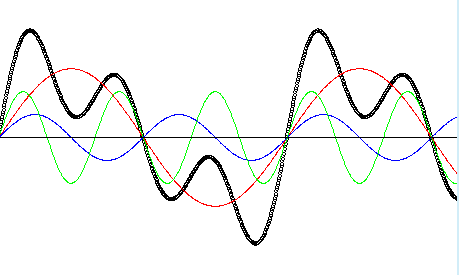


E.g.,


The simple waves that make up the complex wave are:
| Component wave | Frequency | Amplitude |
| A | 100 Hz | 30 dB |
| B | 200 Hz | 10 dB |
| C | 300 Hz | 20 dB |
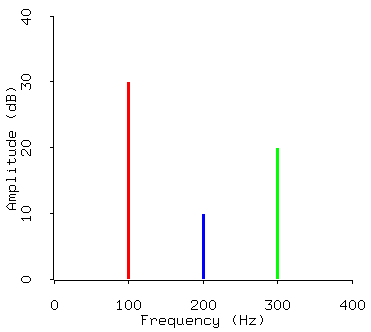
We typically diagram these as vertical lines in a graph where the
horizontal position represents the frequency of the simple wave
and its height represents the amplitude:

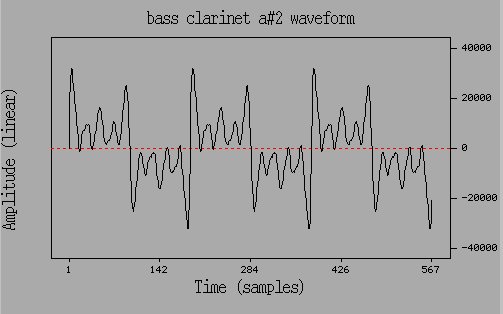
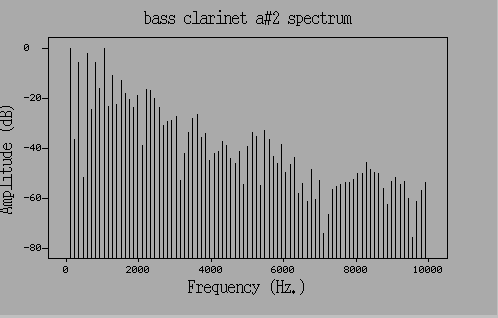
This kind of spectrum diagram is especially convenient for naturally occurring waves, which are typically composed of a lot of simple waves. Two examples:
A bass clarinet playing an A-sharp (two below middle C):


(Sounds and plots for the musical instruments come from Geoffrey Sandell's SHARC Timbre database at Loyola University Chicago.)
 Don't confuse these
spectrum diagrams with spectrograms (which we'll cover later).