
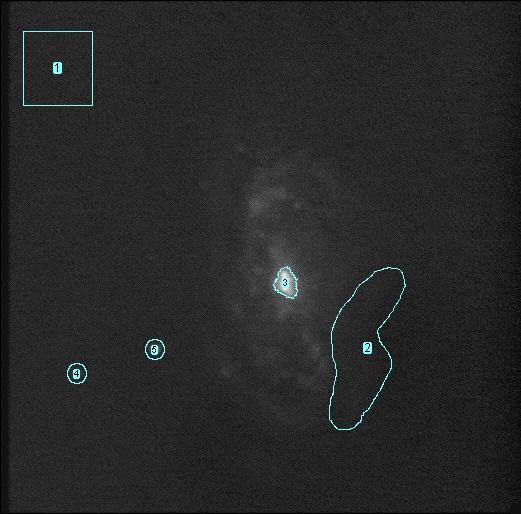
Pixel Counts:
Background noise level (measured along left edge of region 1 using profile) ~19 counts (in terms of base to peak of plot, minimum 409, max 428) Faintest stellar magnitude detected: Brightest Stellar Magnitude detected: Image Scale ~ 73.18 pixels/arcmin Image Sharpness: |
Pixel Counts:
Background Noise Level: Faintest stellar magnitude detected: Brightest Stellar magnitude detected: Image Scale: ~73.18 pixels/arcmin Image Sharpness: |
 |
 |
 |
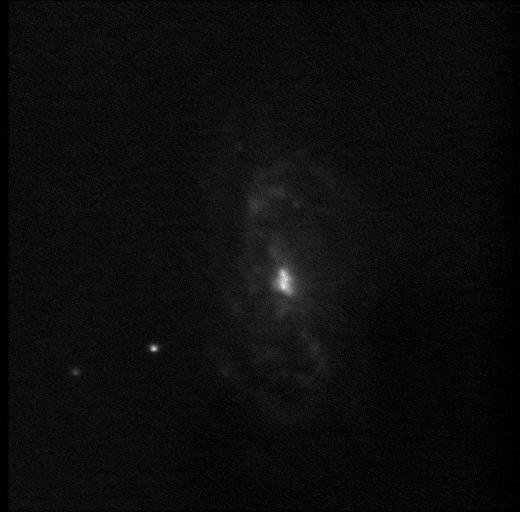 |
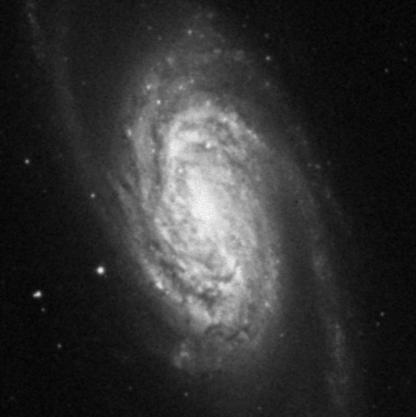
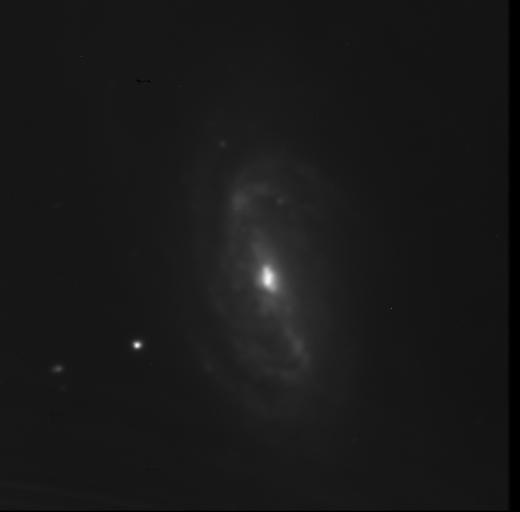
| STScI DSS POSS2/UKSTU Blue image 7'x7' | My Clear Filter Image | My Blue Filter Image |
• Raw • Log • Manipulation •
• Back • Index •
_________________________________________
Banner image is a slice of HST image by NASA/ESA