After the image is normalized, you may invoke the process which
detects bands in the experimental lanes. From another menu, you may
choose to detect automatically, semi-automatically, or manually.
Each band detected is marked with a small bar across the lane in which the
band was detected; on color displays, this bar is green.
The user may edit the results of the band detection
to add or delete band bars as necessary.
Deleting band bars may be necessary where
the peak-detection algorithm erroneously identifies an artifact on
the image as a band. Interactive band bar addition may
be required to identify low-intensity bands.
Where two bands are very closely spaced, the program may flag just one
band as it may not be able to separate adjacent intensity peaks.
Editing is similar to that described earlier in
Section 3.5.
- Pointer to Operations Submenu, click [Exp Bands] .
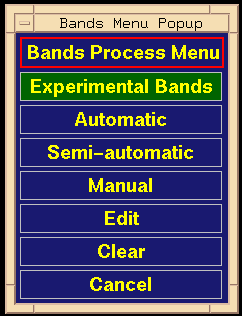
- The Experimental Bands Process Menu appears (Figure 3.12).

Figure 3.12: Experimental Bands Process Menu.
Its buttons and meanings are:
- [Automatic] Band detection is automatic, followed by
editing.
- [Semi-automatic] Put band at peak intensity near click.
- [Manual] You pick the location of each band bar.
- [Edit] The same as automatic.
- [Clear] If bands have been detected, they are cleared.
- [Cancel] You choose not to detect bands at this
point.
Clicking any of these menu buttons forces the menu to disappear.
Clicking [Clear] or [Cancel]
returns control to the Operations Submenu. Clicking any of the others
keeps you in an edit mode until MB3 is clicked, at which point control
is returned to the Operations Submenu.
- As each band is identified, its base-pair size appears in
the Status Information Region.
- During editing, a popup window allows you to switch between
semi-automatic and manual editing modes.
This is the same popup which appears for the size-standard bands
(Figure 3.8).
The popup has one button which toggles between
[On] and [Off]
(you do/don't want semi-automatic editing).
- Clicking MB3 indicates the end of editing, and control is
returned to the Operations Submenu. You may re-enter
experimental band detection; click [Exp Bands] .
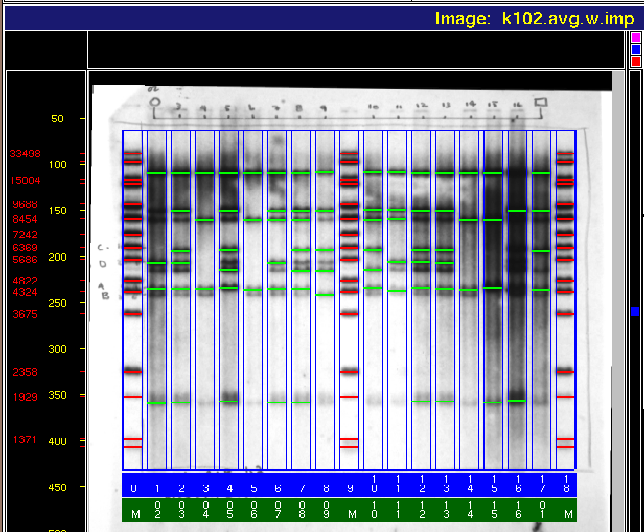
Figure 3.13 shows the finished analyzed image.
Experimental bands are shown in green.

Figure 3.13: Image k102 after detection of experimental bands (green).
Note that the program has missed some bands in areas of severe darkness.
The program has also missed several faint bands; many of these could have
been detected by adjusting the band-detection threshold. Missed bands
are easily added with manual editing.
Backward to Chapter 3 outline
Backward to Chapter 3, section 3.6
Forward to Chapter 3, section 3.8
Table of Contents


