Understand how the decondensed structure of chromosomes in
the nucleus facilitates gene expression
Understand the difference in efficiency between a
disk-shaped and a spherical nucleus
Be able to summarize the experimental evidence that
indicates the eukaryotic chromosome is one linear DNA molecule
Understand the current state of knowledge about higher level
coiling events
Last time, we looked at all the organizational features
necessary to handle gene expression in chromatin domains. Today,
we need to look at the higher-level structural features required
for transcription, replication and chromosome segregation.
The nucleus is organized for carrying out transcription and
replication
Decondensed chromosomes in the interphase
nucleus occupy discrete territories
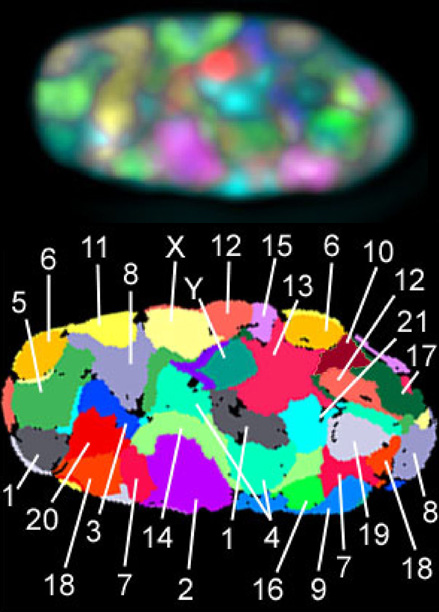
Chromosome painting demonstrates that chromosomes occupy
discrete volumes within the interphase nucleus. There are
referred to as "chromosome territories".
Note that the image at right is based on a 2-dimensional
slice through a 3-dimensional nucleus. Not all copies of all
chromosomes can be seen in any given plane.
Top: FISH (Fluorescence in situ hybridization)
labeling of all 24 different human chromosomes (1 - 22,
X, and Y) in a fibroblast nucleus, each with a different
combination of in total seven fluorochromes. Shown is a
mid-plane of a deconvoluted image stack which was recorded
by wide-field microscopy. Bottom: False color
representation of all chromosome territories visible in
this mid-section after computer classification.
Researchers
in Dr. John Sedat's lab at UCSF wanted to determine
whether specific loci for a given homologous pair of
chromosomes were physically associated during
interphase. This required an imaginative approach. Yeast
was transformed with the E. coli lac operator
sequence, which is specifically bound by the lac
repressor protein. Next, the same yeast strain was
transformed with a chimeric gene in which the Green
Fluroescent Protein (GFP) was added to the amino
terminus of the E. coli lac repressor gene. The
chimeric gene was inserted at random into a different
chromosomal site. Since the chimeric lac repressor/GFP
protein will only bind to the lac repressor sequence, a
diploid yeast nucleus should only have two binding
sites, one for each homologous locus.
The time-lapse video by Wallace Marshall
shows the results.
The chimeric GFP bound to the lac repressor binding site in
yeast chromosomes shows up as fluorsecent signal.
These results demonstrate that
both homologous loci, although free to move within the
nucleus, are constrained in their motion, and maintain a
close association even during interphase.
A disk-shaped nucleus accommodates nuclear and cytoplasmic
transport
Collings DA et al. (2000) Plant nuclei can contain extensive
grooves and invaginations. Plant Cell 12: 2425-2439.
Although we often visualize the nucleus as a sort of basketball,
studies in onion epidermal cells have shown that these nuclei are
lens-shaped, with a surface formed by grooves, invaginations and
channels. Grooves were seen to go as deep as 6 µm, and
invaginations as deep as 8 µm into the nucleus.
A - Serial sections through onion
epidermal nuclei, in which DNA has been labeled using DAPI
dye. DNA is visualized by UV fluorescence.
B. - Light microscopic images of
sections shown in A.
C - 3D reconstruction of surface
based on DAPI fluorescence. Nc = nucleoli; G = groove;
arrow shows an invagination.
Recalling that the nucleus is thought to be a specialized
structure formed from the endoplasmic reticulum, what is the
importance of these findings? That is, how might a lens shape with
a convoluted surface function more efficiently than a rigid
spherical shape?
A sphere is the geometrical shape that minimizes surface area per
unit volume. Both the lens shape and the channels, invaginations
and groves would contribute to increasing the surface area. Since
the nuclear envelope controls traffic of macromolecules into and
out of the cell, that traffic can be carried more efficiently with
a large surface area. In particular, grooves and invaginations
extending deep into the nucleus ensure that no part of the nucleus
is far from the nuclear membrane. This will minimize the time
required for a transcript to exit the nucleus, or for a protein to
enter, and find its way to a chromosome.
Each eukaryotic chromosome is a single linear DNA molecule,
packaged into chromatin
We have been discussing domains of chromatin as functional units
in gene expression, some up to 150kb in length. But we haven't yet
addressed the question, "does a chromosome have many molecules of
DNA, or only one?" There are three lines of evidence which
demonstrate that eukaryotic chromosomes are single linear DNA
molecules.
a) Replication in
the presence of bromodeoxyuridine
First, we have to review how semi-conservative DNA replication
works.
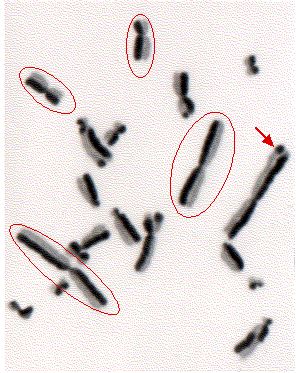
When chromosomes
from the semi-conservative replication experiment are
viewed in fluroescence microscopy, we seethat
that each chromatid, and hence the chromosome, is a single
DNA molecule. If this were not so, then we would
simply see an even distribution of dye in both
chromatids, and a gradual dilution of BUdr (dark) in
subsequent cell generations. Instead, we see a discrete
partitioning of the BUdr into one or the other of
the sister chromatids, which is consistent with the idea
that each chromatid contains one old strand and one
newly-replicated strand.
In some chromosomes, dye has
been partitioned completely to one chromatid or the other
(circled). In other chromosomes, sister-chromatid exchange
is evidenced by a checkered-pattern, in which dye abruptly
shifts from one chromatid to the other (arrow)
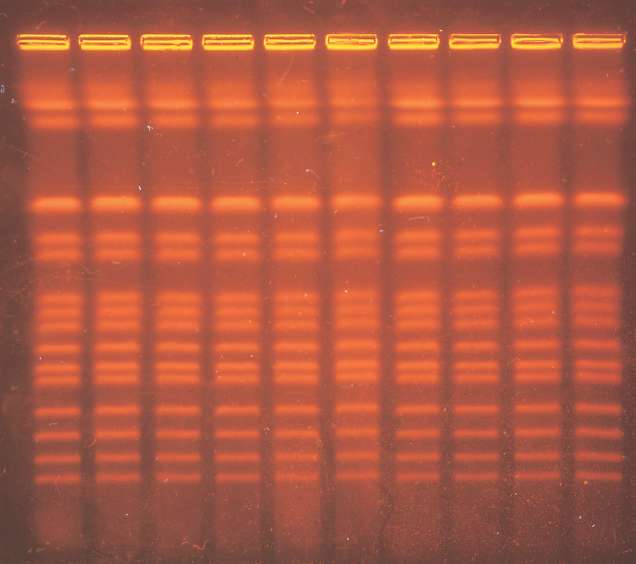
b)
Pulsed-field electrophoresis of yeast chromosomal DNA
i) Method - direction of
electric field changes periodically, making DNA zig-zag through
the gel matrix. Effectively, the path of travel is much longer.
For more on pulsed-field gel electrophoresis, see http://www.nature.com/nprot/journal/v2/n3/full/nprot.2007.94.html
Yeast
(Saccharomyces cerevisiae ) cells were embedded
in agarose, and the agarose plugs treated with enzymes
to degrade the cell walls. Agarose plugs are then loaded
into the wells of a pulsed-field gel.
All 15 yeast chromosomes can be resolved on this gel.
Allen TD, Jack EM, Harrison CJ (1988) The three dimensional
structure of human metaphase chromosomes determined by scanning
electron microscopy. In Adolph KW (1988) Chromosomes and Chromatin
Volume II, CRC Press. Boca Raton FL. Chapter 10, pp. 51-72.
We finally have all the pieces in place to complete our model of
the eukaryotic chromosome by defining its high-order structure
.
At
51000X,
it is possible to identify rounded projections of about
1.5-2x the diameter of chromatin. These have been
interpreted as the loop domains described above.
Although the resolution of SEM is good enough, sample
preparation technology has not yet made it possible to
observe finer structure in chromatin loops. It is also
worth pointing out that in the figure we are actually
seeing two sister chromatids, which will separate
during anaphase. This is evidenced by the gap between the
chromatids. Note the interchromatid fibers, which are
about the right size for individual chromatin solenoids.
(Allen et
al.,Fig. 4 p57) Detail of a single chromosome viewed at
high resolution in the SEM. The majority of the
chromosome surface displays a twisted loop configuration
with approximately twice the diameter of the individual
fibers which are seen mainly as interchromatid fibers
(arrowed). (Magnification x 51000).
Now
let's
zoom out by a factor of 5 to look at complete chromosomes.
(Allen et al.
Fig. 3, p56) FIG. 3. Part of a metaphase spread
preparation prepared without banding techniques,
illustrating small circumferential grooves on the
surface of the chromatids. (Magnification x 9500).
Some segmentation and
indentations of chromosomes apparent, but now compare
with scanning EM of G-banded chromosomes.
Here,
we
can see 'circumferential grooves' that run as a
helix down each chromatid. Again, this indicates helical
organization at the highest level of chromosome
structure. It's important to realize that when we do
any kind of banding technique, we are altering the
chromosome in some way,such that they take up dye
more readily. Usually, a partial hydrolysis of protein
with the protease trypsin is used. So you have to remember
that what we're seeing is not the way the untreated
chromosome would actually look, if we could see it with
light, but rather an altered structure whose purpose is
to bring out structural features.
(Allen et
al., Fig. 5, p58) Low-power micrograph of a G-banded
metaphase spread. The chromatid arms are segmented by
circumferential grooves which run as a helix down each
chromatid. (Magnification x 2800).
Evidence
for at least 2 levels of coiling above chromatin attachment to
the scaffold (or, what Chinese hamsters can teach us about
chromosomes)
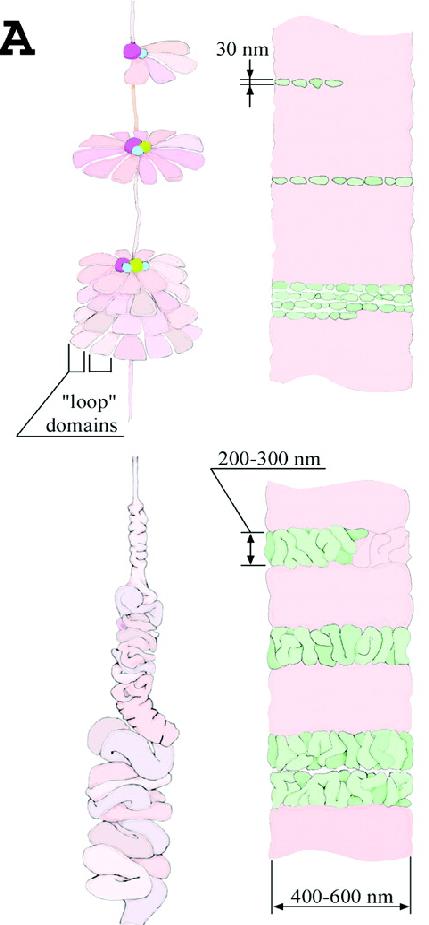
Two alternative models of
high-level chromatin folding during prophase are presented
in A.
The top model postulates that as chromatin condenses,
the nuclear matrix joins a uniform number of chromatin
domains into a disk-shaped floret of chromatin domains.
This would mean the chromosome could be visualized as a
stack of discs, each containing a floret.
The second model postulates that chromatin condenses
into a less-regular coil on indeterminate configuration.
The thickness of each unit would be larger than the a
chromatin domain, as in the first model. These coils, in
turn, coil into a helix, to give the final mitotic
chromosome.
Note on 30 nm label in A.
At the time this paper was written, the 30 nm fiber was
considered to the primary organizational structure for
chromatin. The authors have labeled the width of a floret
as being 30 nm, consistent with that model. However, the
alternative structure, that chromatin largely consists of
disorganized bundles of 10-nm fibers, is still consistent
with the models postulated in this paper.
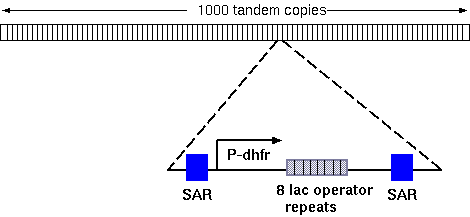
To test these hypotheses,
constructs were made containing 8 tandem repeats of the E.
coli lac operator sequence, flanked by SAR sequences. This
construct was transfected into Chinese Hamster Ovary (CHO)
cells in culture. Transformed cells, which had
incorporated the construct into chromosomes, were screened
by flow cytometry for cells that contained large numbers
of copies of the construct. One cell line, dSAR-d11, which
had approx. 1000 tandem copies of the construct inserted
at a single locus.
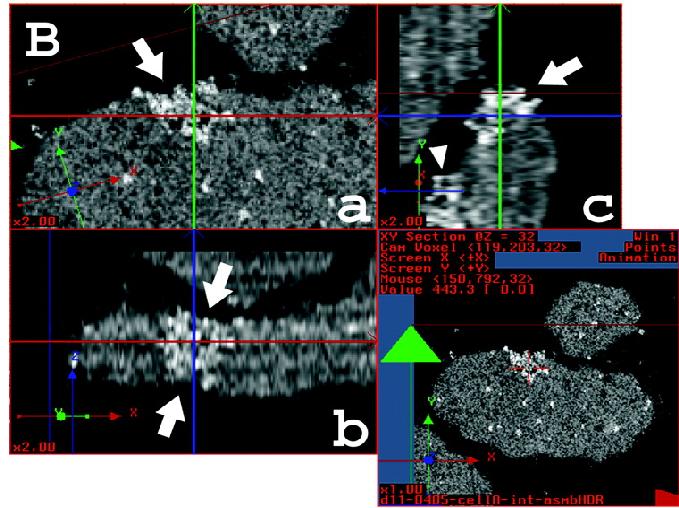
To enable
detection of the lac operator sequences in a chromosome, cells
were co-transfected with another construct that expressed the lac
repressor. The lac repressor protein binds to the lac operator
repeats in-vivo.
The images in Fig. 9B are
from chromosomes incubated with gold-tagged antibodies to
the lac repressor protein. This immuno-gold staining
method detects lac repressor binding to the chromosomes as
bright gold particles. Fig. 9B a-c are examples of slices
visualized by electron microscopy, in X, Y and Z axes. A
stack or serial images, spanning the thickness of each
chromosome visualized, can be deconvoluted in software to
create a 3D-image of the chromosome, showing the location
of the lac operator sequence in the chromosome.
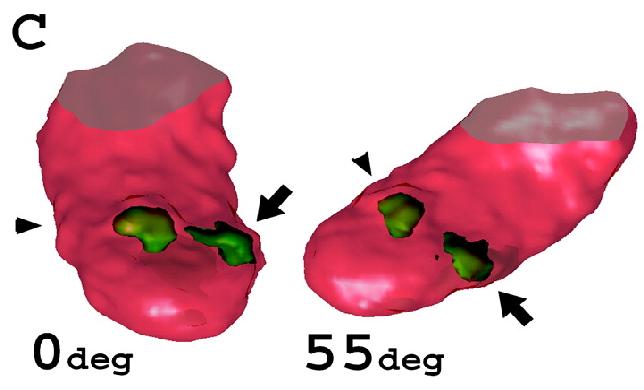
Fig. 9C is a
3D-reconstruction of one chromosome.
If
the first hypothesis was true, we would see the lac
operator sequence as occupying a thin strip along the
entire width of each chromosome.
The
observations of numerous chromosomes from this cell
line are consistent with the second hypothesis. Signal
for the lac operator only spans a localized region
about 250 - 300 nm wide, on each chromosome. In other
words, the band of lac operator sequences only takes
up part of the width of the chromosome. If the first
hypothesis was true, then the operator sequences would
always span the entire width of the chromosome. This
indicates that the entire 1000 unit repeat is included
in a region which folds first, and then coils as part
of the higher-level coiling of the chromosome.
Studies
of numerous chromosomes support the hypothesis that at least two
higher-order levels of chromatin folding occur during condensation
of chromatin in prophase.
The highest
level of coiling appears to be a
helix
The highest levels of coiling are probably mostly absent in the
interphase nucleus. However, at any given time, different regions
of chromosomes may be coiled or uncoiled, to one degree or
another. Highly-coiled chromosomal regions will not be genetically
active.
Electron Microscopy
Tomography (EMT) of DNA-Depleted Human (HeLa) Cell-Line
Chromosome
Human chromosomes
were treated with DNAseI to remove most of the DNA, and
slides were scanned in layers by electron microscopy.
Layers were reconstructed into a 3-dimensional image.
Summary
Decondensed chromosomes in the interphase nucleus occupy
discrete territories
A disk-shaped nucleus accommodates nuclear/cytoplasmic
transport
The eukaryotic chromosome is a single DNA molecule
Chromatin domains undergo an additional level of coiling,
which is visualized as a thick cylinder. The nature of this
level of coiling requires further study.
The highest level of chromosome organization appears to be a
high-order helical coil of chromatin to form a cylindrical
chromosome.