PLNT4610 Assignment 1 Report


DNAplotter tracks file

AS1 seqs_1.nam

fea2tsv.sh


Actinobacter_baumanii_MDR-TJ         
                    
region

(f-c)/(f+c)
A f(2:1835)=1095 c(2:1835)=739 0.194
B f(1836:3698)=1097 c(1836:3698)=1144 -0.228


Acinobacter_baumanii_MDR-TJ.fea
Acinobacter_baumanii_MDR-TJ.fea.tsv
Acinobacter_baumanii_MDR-TJ.fea.ods


Candidatus_Hamiltonella_defensa_5AT


Region

(f-c)/(f+c)
A f(1:1018) =478 c(1:1018)=540 -0.06
B f (1019:2101)=507
c(1019:2101)= 576 -0.06


Candidatus_Hamiltonella_defensa_5AT.fea
Candidatus_Hamiltonella_defensa_5AT.fea.tsv
Candidatus_Hamiltonella_defensa_5AT.fea.ods


CstercDSM8                                                                                                                    


Region

(f-c)/f+c)
A f(1:1450)=1013 c(1:1450)=437 0.39
B f(1451:2550)=242 c(1451:2550)=858 -0.56


CstercDSM8.fea
CstercDSM8.fea.tsv
CstercDSM8.fea.ods


Escherichia_coli_synthetic                                                                                        

                    
Region

(f-c)/(f+c)
A f(1:1511,3703:4332)=799 c(1:1511,3703:4332)=712 0.06
B f(1512:3702) = 1312 c(1512:3702) = 1509 -0.11


Escherichia_coli_synthetic.fea
Escherichia_coli_synthetic.fea.tsv
Escherichia_coli_synthetic.fea.ods


Halobacterium_salinarum_R1   
                                                                

Region

(f-c)/(f+c)
A f(1:798, 1836:2040)=490
c(1:798, 1836:2040)=513 -0.023
B f(799:1836)= 506 c(799:1836) = 532 -0.025


Halobacterium_salinarum_R1.fea
Halobacterium_salinarum_R1.fea.tsv
Halobacterium_salinarum_R1.fea.ods


Klebsiella_pneumoniae_BAA-2146      

           
Region

(f-c)/(f+c)
A f(2:2546)=1367 c(2:2546)=1178 0.08
B f(2547:5149) =1057 c(2547:5149) =1546 -0.19
                                                                                           

Klebsiella_pneumoniae_BAA-2146.fea
Klebsiella_pneumoniae_BAA-2146.fea.tsv
Klebsiella_pneumoniae_BAA-2146.fea.ods


Natronomonas_moolapensis_8.8.11    


Region

(f-c)/(f+c)
A f(1:3,1492:2882)=686 c(1:3,1492:2882)=708 -0.02
B f(5:1491)=715 c(5:1491)= 772 -0.04


Natronomonas_moolapensis_8.8.11.fea
Natronomonas_moolapensis_8.8.11.fea.tsv
Natronomonas_moolapensis_8.8.11.fea.ods


Salmonella_enterica_enterica        


Region

(f-c)/(f+c)
A f(1:2150)=1211 c(1:2150)=939 0.13
B f(2151:4291) =860 c(2151:4291)= 1281 -0.20

Salmonella_enterica_enterica.fea
Salmonella_enterica_enterica.fea.tsv
Salmonella_enterica_enterica.fea.ods


Sinorhizobium_meliloti_1021       


Region

(f-c)/(f+c)
A f(1:1692)=968 c(1:1692)=724 0.14
B f(1693:3361) =769 c(1693:3361)=900 -0.07

Sinorhizobium_meliloti_1021.fea
Sinorhizobium_meliloti_1021.fea.tsv
Sinorhizobium_meliloti_1021.fea.ods


Streptococcus_mutans_LJ23                                                                                                                  


Region

(f-c)/(f+c)
A f(1:1023) =844 c(1:1023)=179 0.65
B f(1024:1945)=196 c(1024:1945) =725 -0.57

  Streptococcus_mutans_LJ23.fea
Streptococcus_mutans_LJ23.fea.tsv
Streptococcus_mutans_LJ23.fea.ods


CONCLUSION  :    -
-The tables included for every genus name, represent the TSB calculations  i.e., {(f-c)/(f+c), where f is the number of CDS features on the forward (leading) strand and c for the CDS features on the complementary (lagging) strand. This calculation helps us understand in which direction is the transcription skewed towards i.e.; forward or complementary.
- A negative TSB value in our tables represent that in that particular region of the genome, the transcription favors the complementary strand and a positive TSB value favors the forward strand.

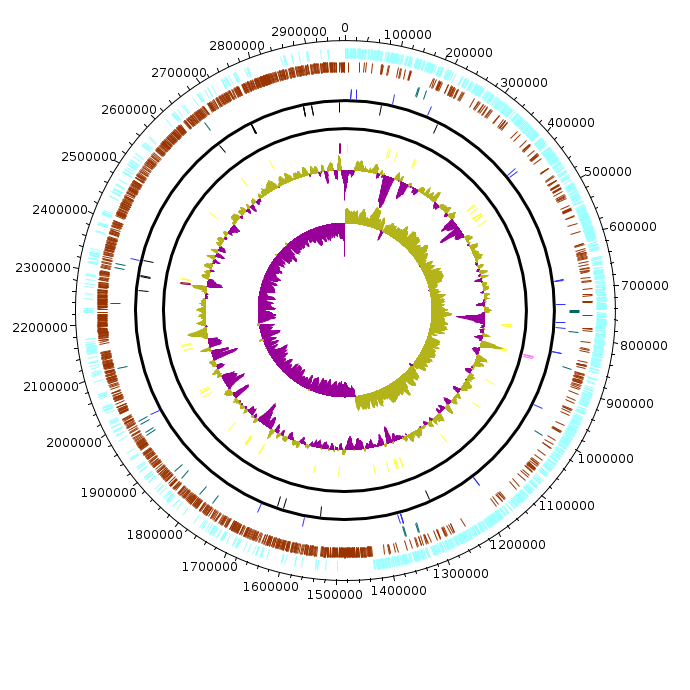
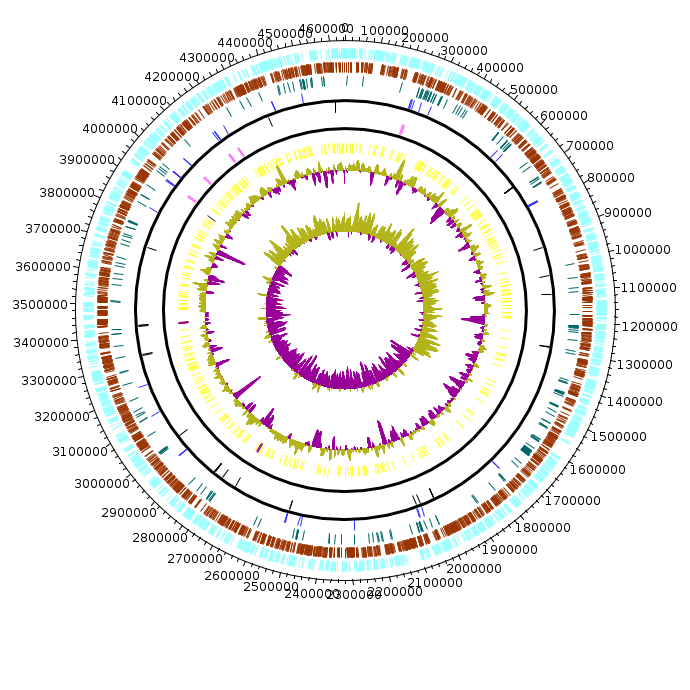
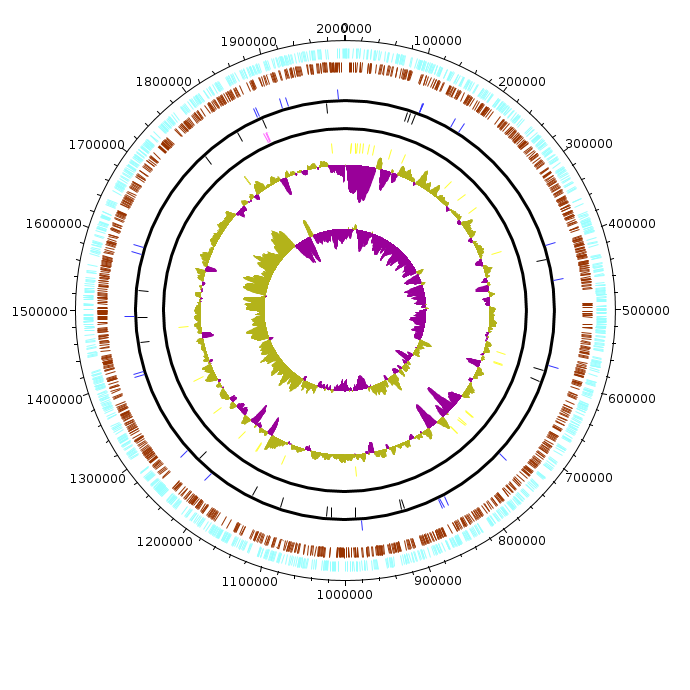
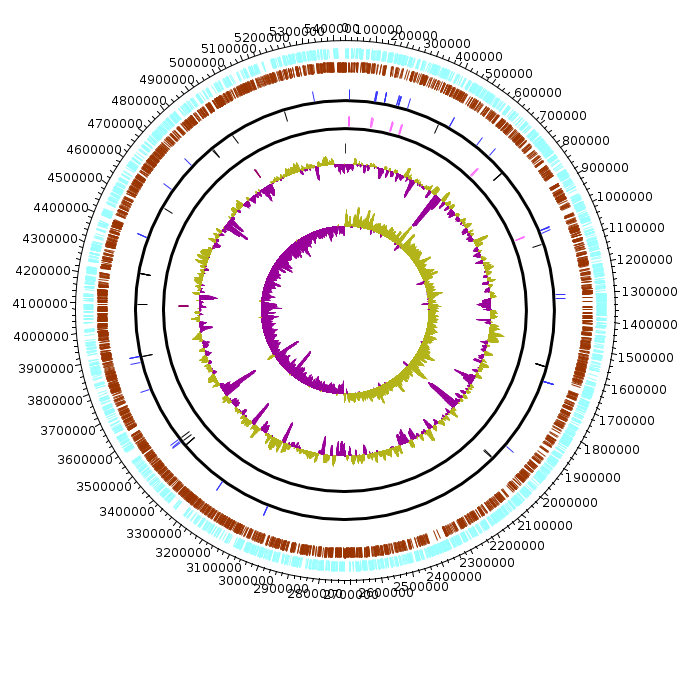
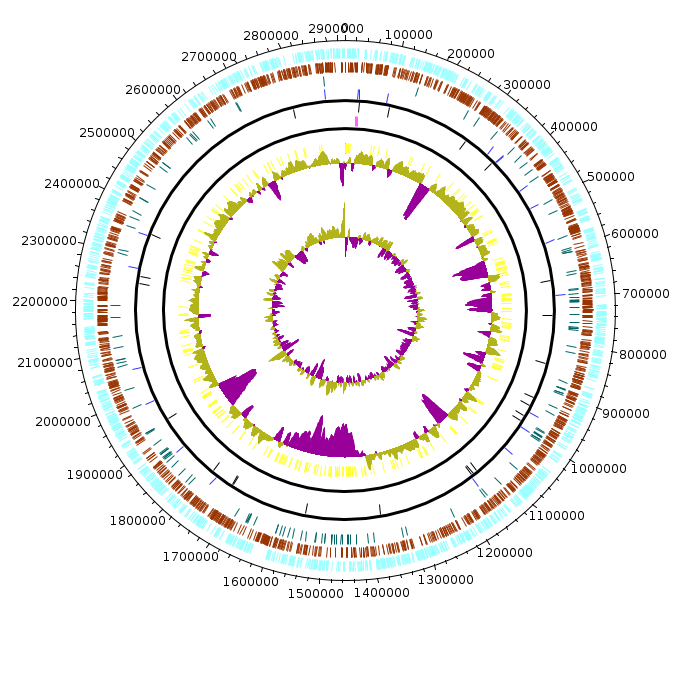
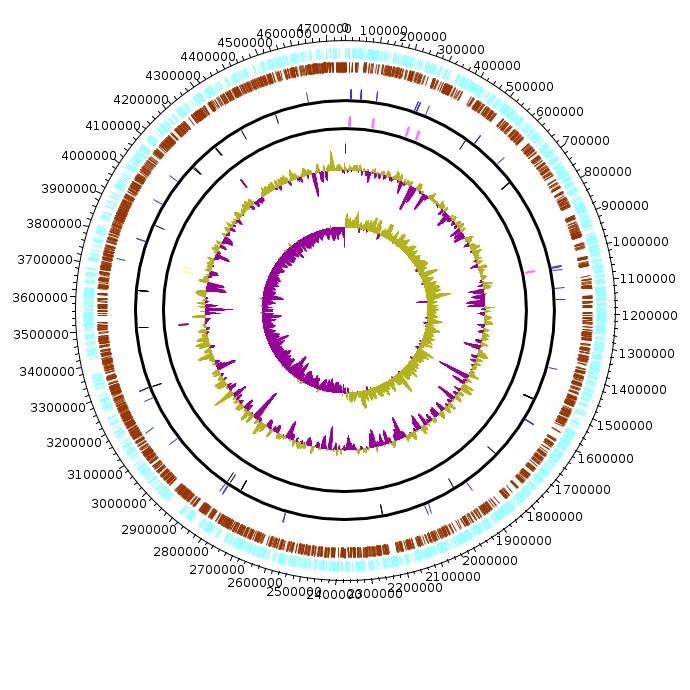
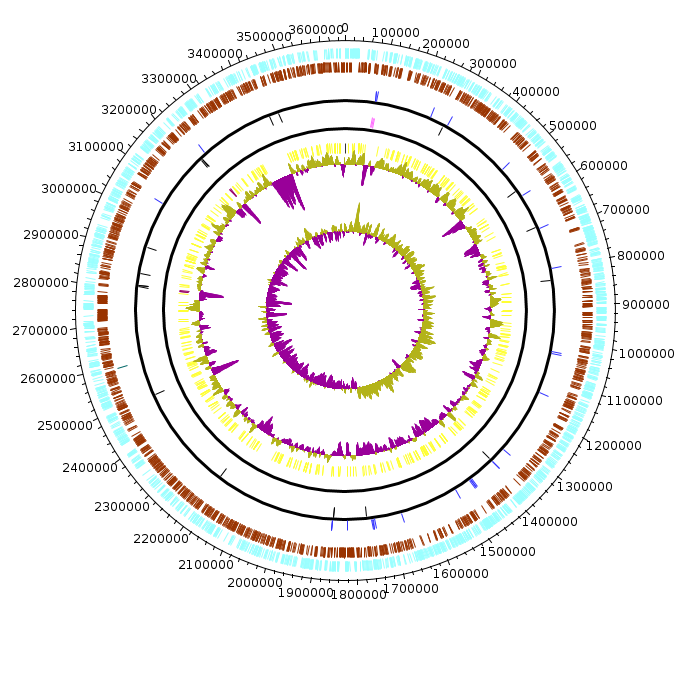
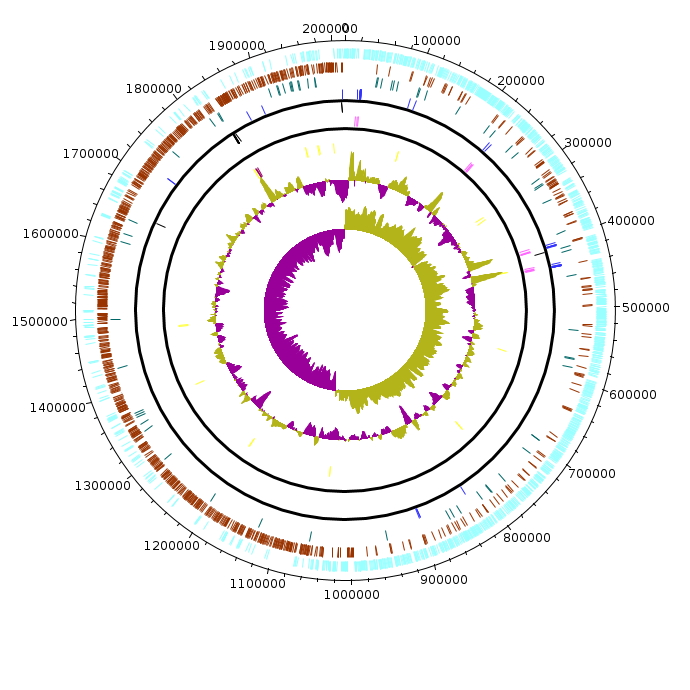
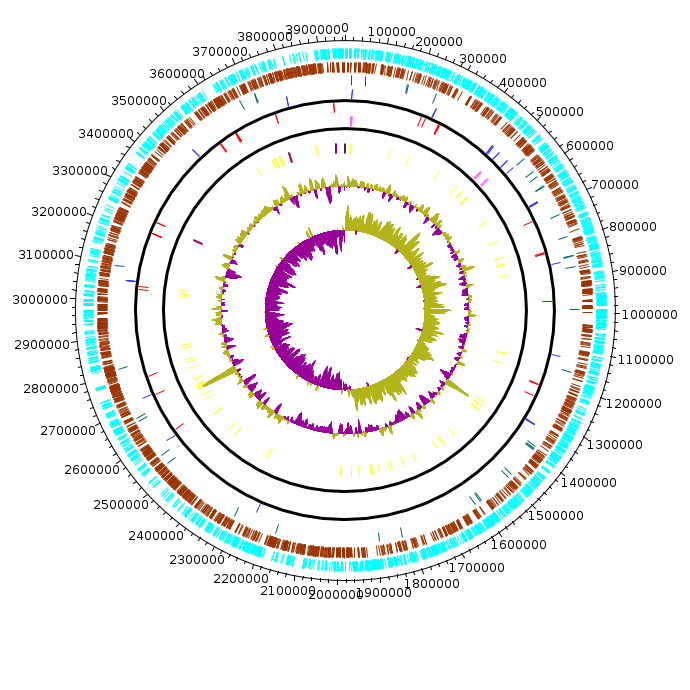
- The G-C (purple and yellow respectively) skew plot from the DNAplotter images provide information about the G-C base pairing concentration of the genome leading and lagging strand.
-The negative G-C skew would represent a more C over G concentration and favor the complementary strand whereas a positive skew represents G over C and favors the forward strand of the genome.

- The general trend that can be seen across the 10 different genomes is that most of the TSB values in region A are mostly positive (e.g., Actinobacter_baumanii_MDR-TJ,CstercDSM8,Escherichia_coli_synthetic etc.,) and region B mostly having a negative value (e.g.,
Klebsiella_pneumoniae_BAA-2146, Salmonella_enterica_enterica etc.,). It can be concluded that transcription in region A of those genomes is favoring the forward strand which in turn means that a  positive GC skew. Moreover, the transcription in region B of those genomes is favoring the complementary strand and thus a negative GC skew.

- However, some of the genus do not fall under this general trend like
Natronomonas_moolapensis_8.8.11,  Halobacterium_salinarum_R1 and Candidatus_Hamiltonella_defensa_5AT.

-The
Candidatus_Hamiltonella_defensa_5AT  genome is different from the other genomes as it has the same TSB values for region A and region B illustrating that the there is not any particular favoring by transcription which makes it difficult for understanding the G-C content concentration over the genome.

- All these observations can be important to understand different genomes of different organisms for
~ understanding the trend of G-C concentration  over the genome
~help in the identification of the leading and lagging strand
~understanding the factors leading to the different trends of transcription over the genome.

- All the genomes studied in this report, have a circular genome. None, of them have linear genome.